
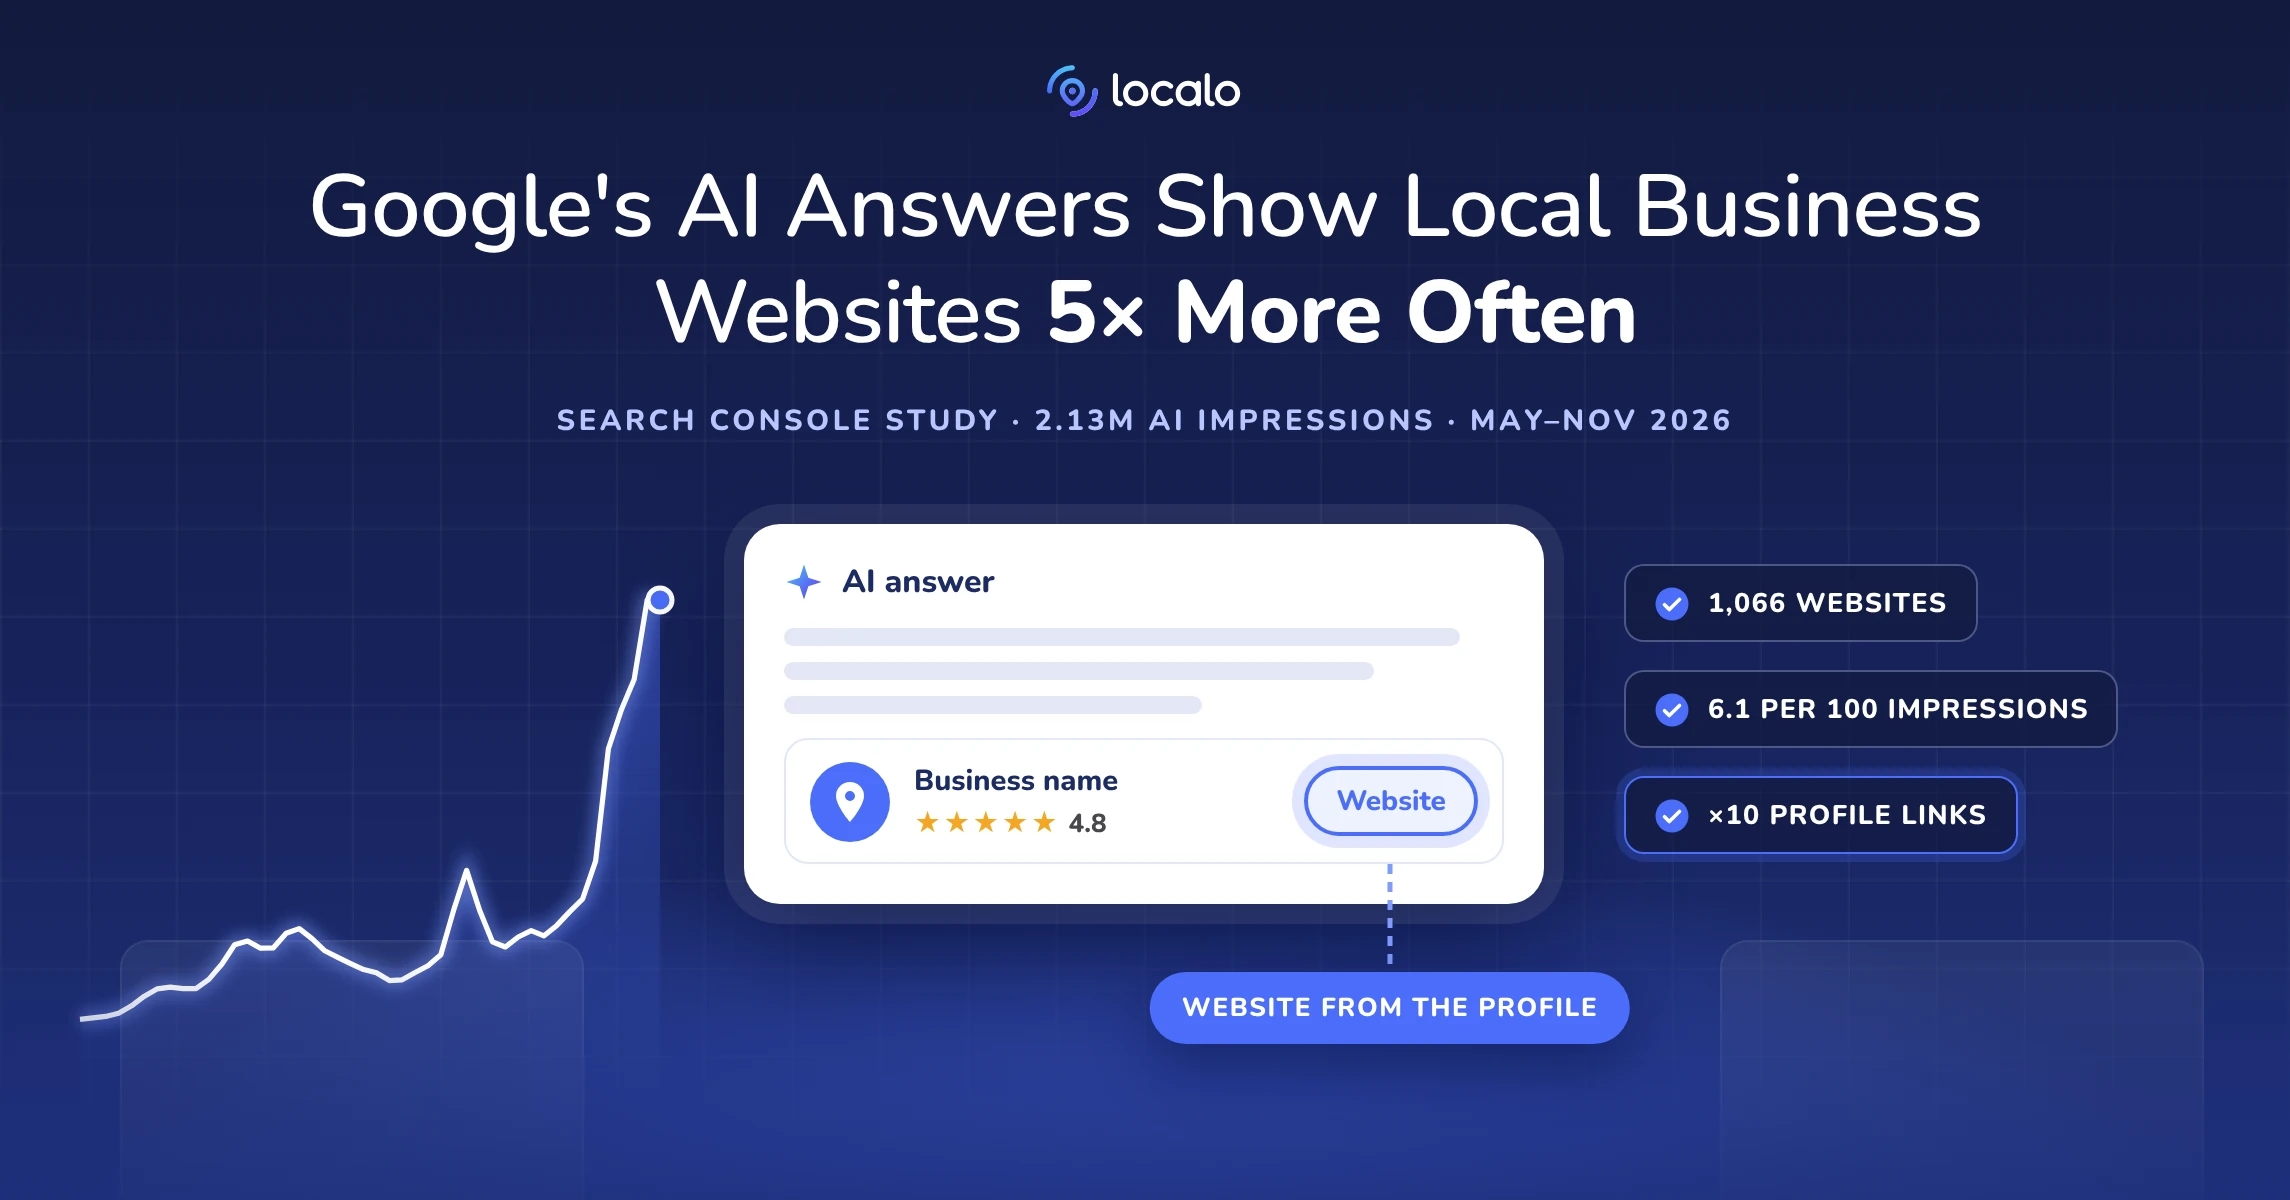
Google’s AI answers show local business websites far more often than six months ago. Localo analyzed 2,134,260 impressions of local business websites in AI Overviews and AI Mode, recorded by Google Search Console between May 18 and November 16, 2026, and matched 1,066 of those websites with their Google Business Profiles.
The websites run on localo.site, the domain of sites built with Localo, the local marketing platform specialists and agencies use to manage client profiles at scale. In the first week of the study (May 18–24), these websites had 1.2 AI impressions for every 100 impressions in the Search results report. In the last week (November 10–16), they had 6.1. The biggest jump came on October 30 and 31 and has held since. The clearest pattern is in the Business Profile’s website field: when it pointed to the localo.site website, that website’s AI impressions grew by a median 76%. When it pointed to a different site, the localo.site website lost a median 9%, and our data doesn’t show how the other site did.
The rest of this study covers how AI impressions grew against all Search impressions, the late-October jump, the two ways AI answers show a business, what separated the websites that grew from those that didn’t, and how to check all of this for a client in Search Console. The data covers localo.site websites only, so it shows how often AI answers showed these pages, not the businesses’ total visibility. Methodology and limitations are at the end.
AI Answers Show Local Business Websites 5x More Often Than in May
Search Console has reported impressions in AI Overviews and AI Mode since June 2026, first for some sites in the UK (Google) and, since August 31, for all websites worldwide (Google Search Central). The report counts how many times a link to a site appeared in a generative AI feature on Google Search. It shows no clicks and no queries, only impressions by page, country, device and date. Our data starts on May 18, before the report launched. The daily figures show no jump in early June or around August 31, when the report reached more websites, so the growth isn’t a side effect of the rollout.
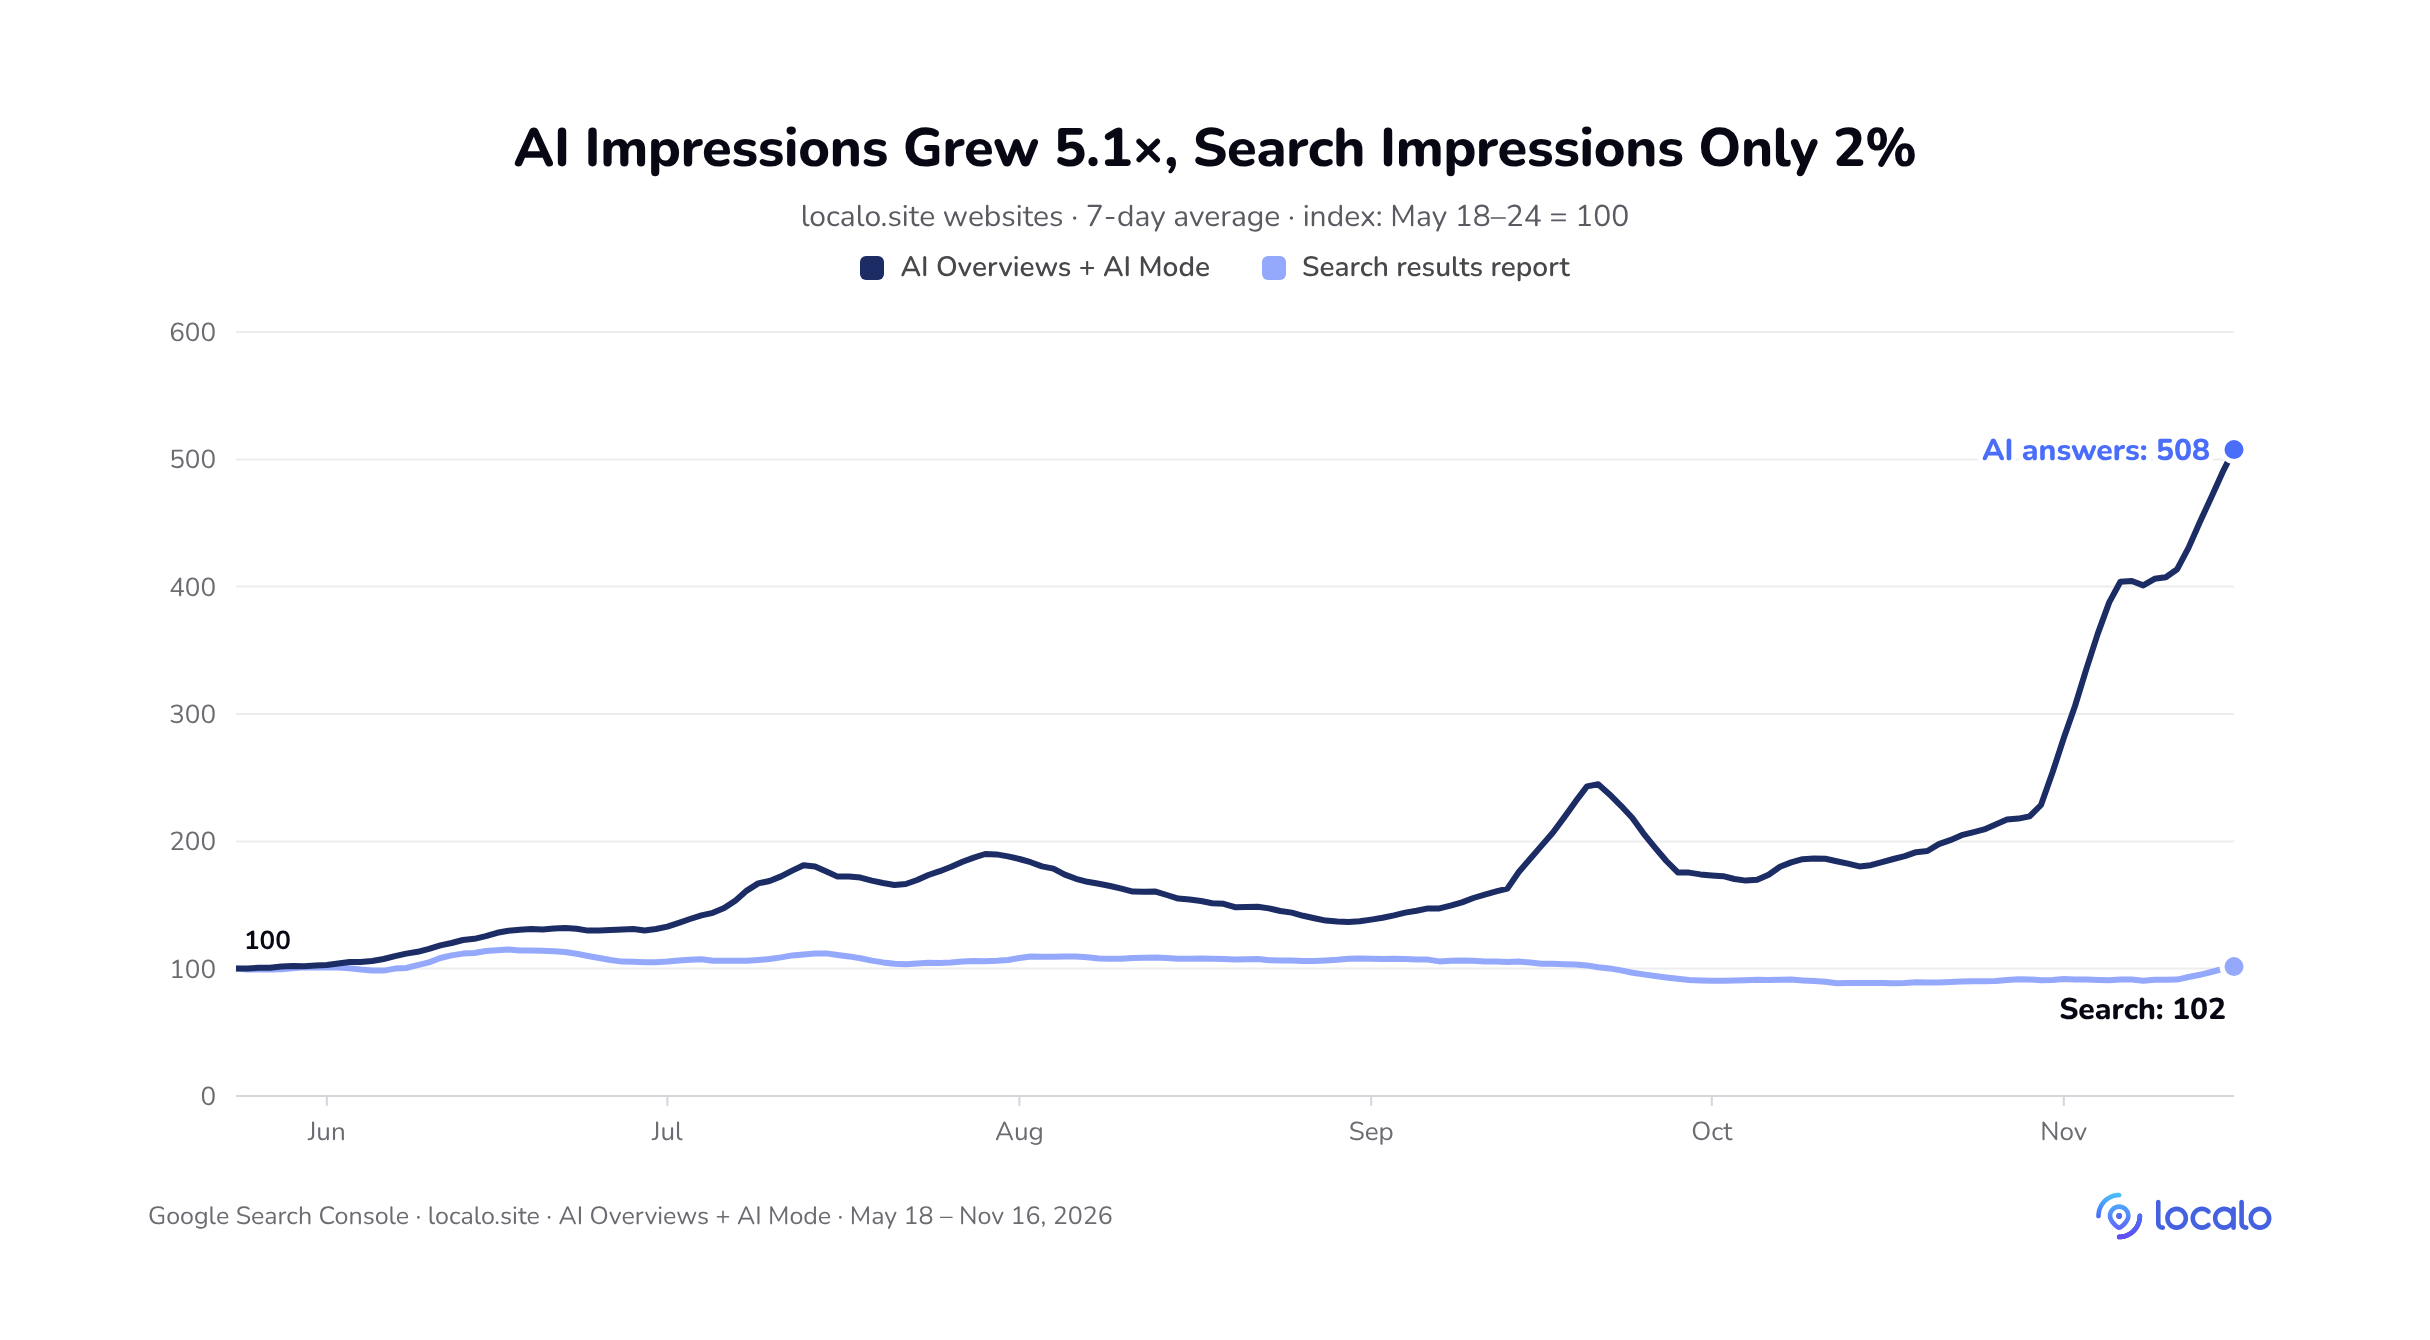
In the first week of the data (May 18–24), localo.site websites had an average of 6,223 AI impressions a day. In the last week (November 10–16), they had 31,592, or 5.1x more. Over the same time, their impressions in the Search results report grew by 2%, and clicks from Search stayed flat at about 6,200 a day.
If more websites in the network explained the growth, impressions in the Search results report would have grown too. They grew only 2%. That’s why this study also uses a simple ratio: AI impressions per 100 impressions in the Search results report. That report also counts impressions in AI features (Search Console Help), so the ratio compares AI impressions with all Search impressions, not with results without AI.
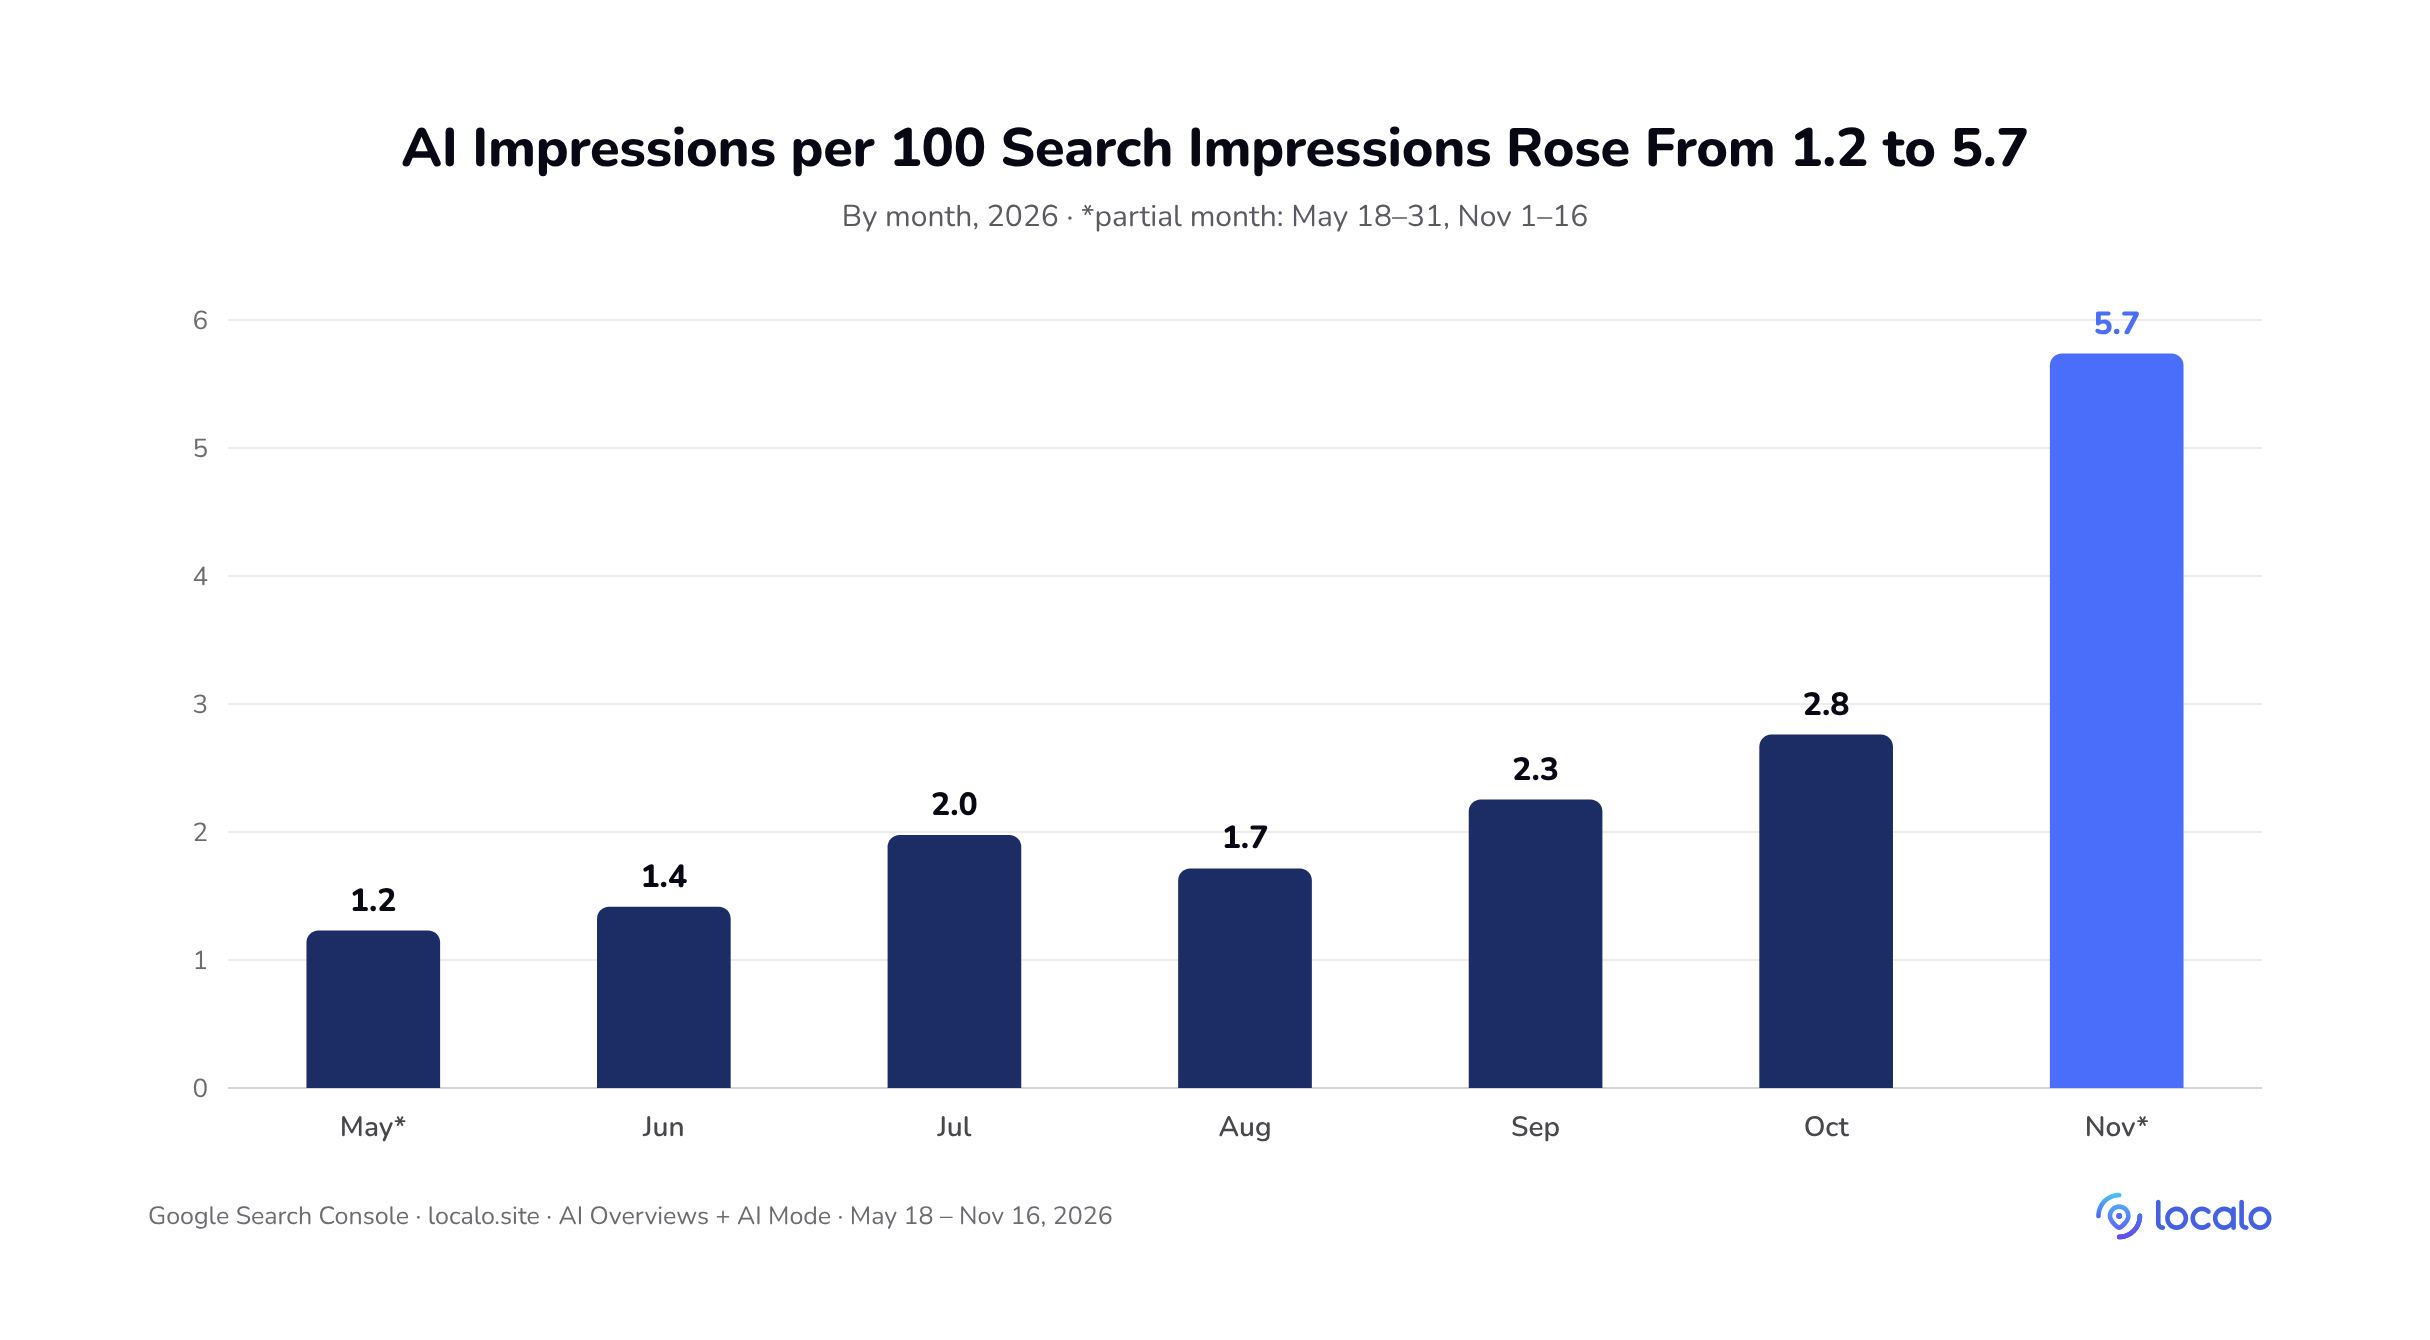
| Month | Days in data | Search impressions per day | AI impressions per day | AI impressions per 100 search impressions |
|---|---|---|---|---|
| May (18–31) | 14 | 511,859 | 6,296 | 1.23 |
| June | 30 | 550,911 | 7,797 | 1.42 |
| July | 31 | 545,827 | 10,793 | 1.98 |
| August | 31 | 548,593 | 9,410 | 1.72 |
| September | 30 | 511,843 | 11,536 | 2.25 |
| October | 31 | 459,180 | 12,677 | 2.76 |
| November (1–16) | 16 | 486,760 | 27,929 | 5.74 |
The ratio didn’t rise in a straight line. It fell from 2.0 in July to 1.7 in August, then grew again from September. In October, search impressions dipped: 10% below September and 16% below June–August. That’s why the ratio grew 22% from September to October, while AI impressions per day grew 10%. In the first half of November, the ratio reached 5.7, more than twice the October level of 2.8, because AI impressions more than doubled.
🔎 Key takeaway:
Google’s AI answers showed local business websites 5x more often in the last week of the data than in the first, while their total Search impressions barely moved.
💡 Tip:
Add AI impressions per 100 search impressions to client reports, next to search impressions. The ratio shows a change in AI answers even when search traffic stays flat, but a dip in search raises it too.

The October 30–31 Jump Has Held
From October 18 to 29, localo.site websites had an average of 13,367 AI impressions a day. They had 14,631 on October 29, 17,863 on October 30 and 22,432 on October 31. The new level held and kept growing: on November 16, the last day in the data, the websites had 35,685 AI impressions, the most in the whole period.
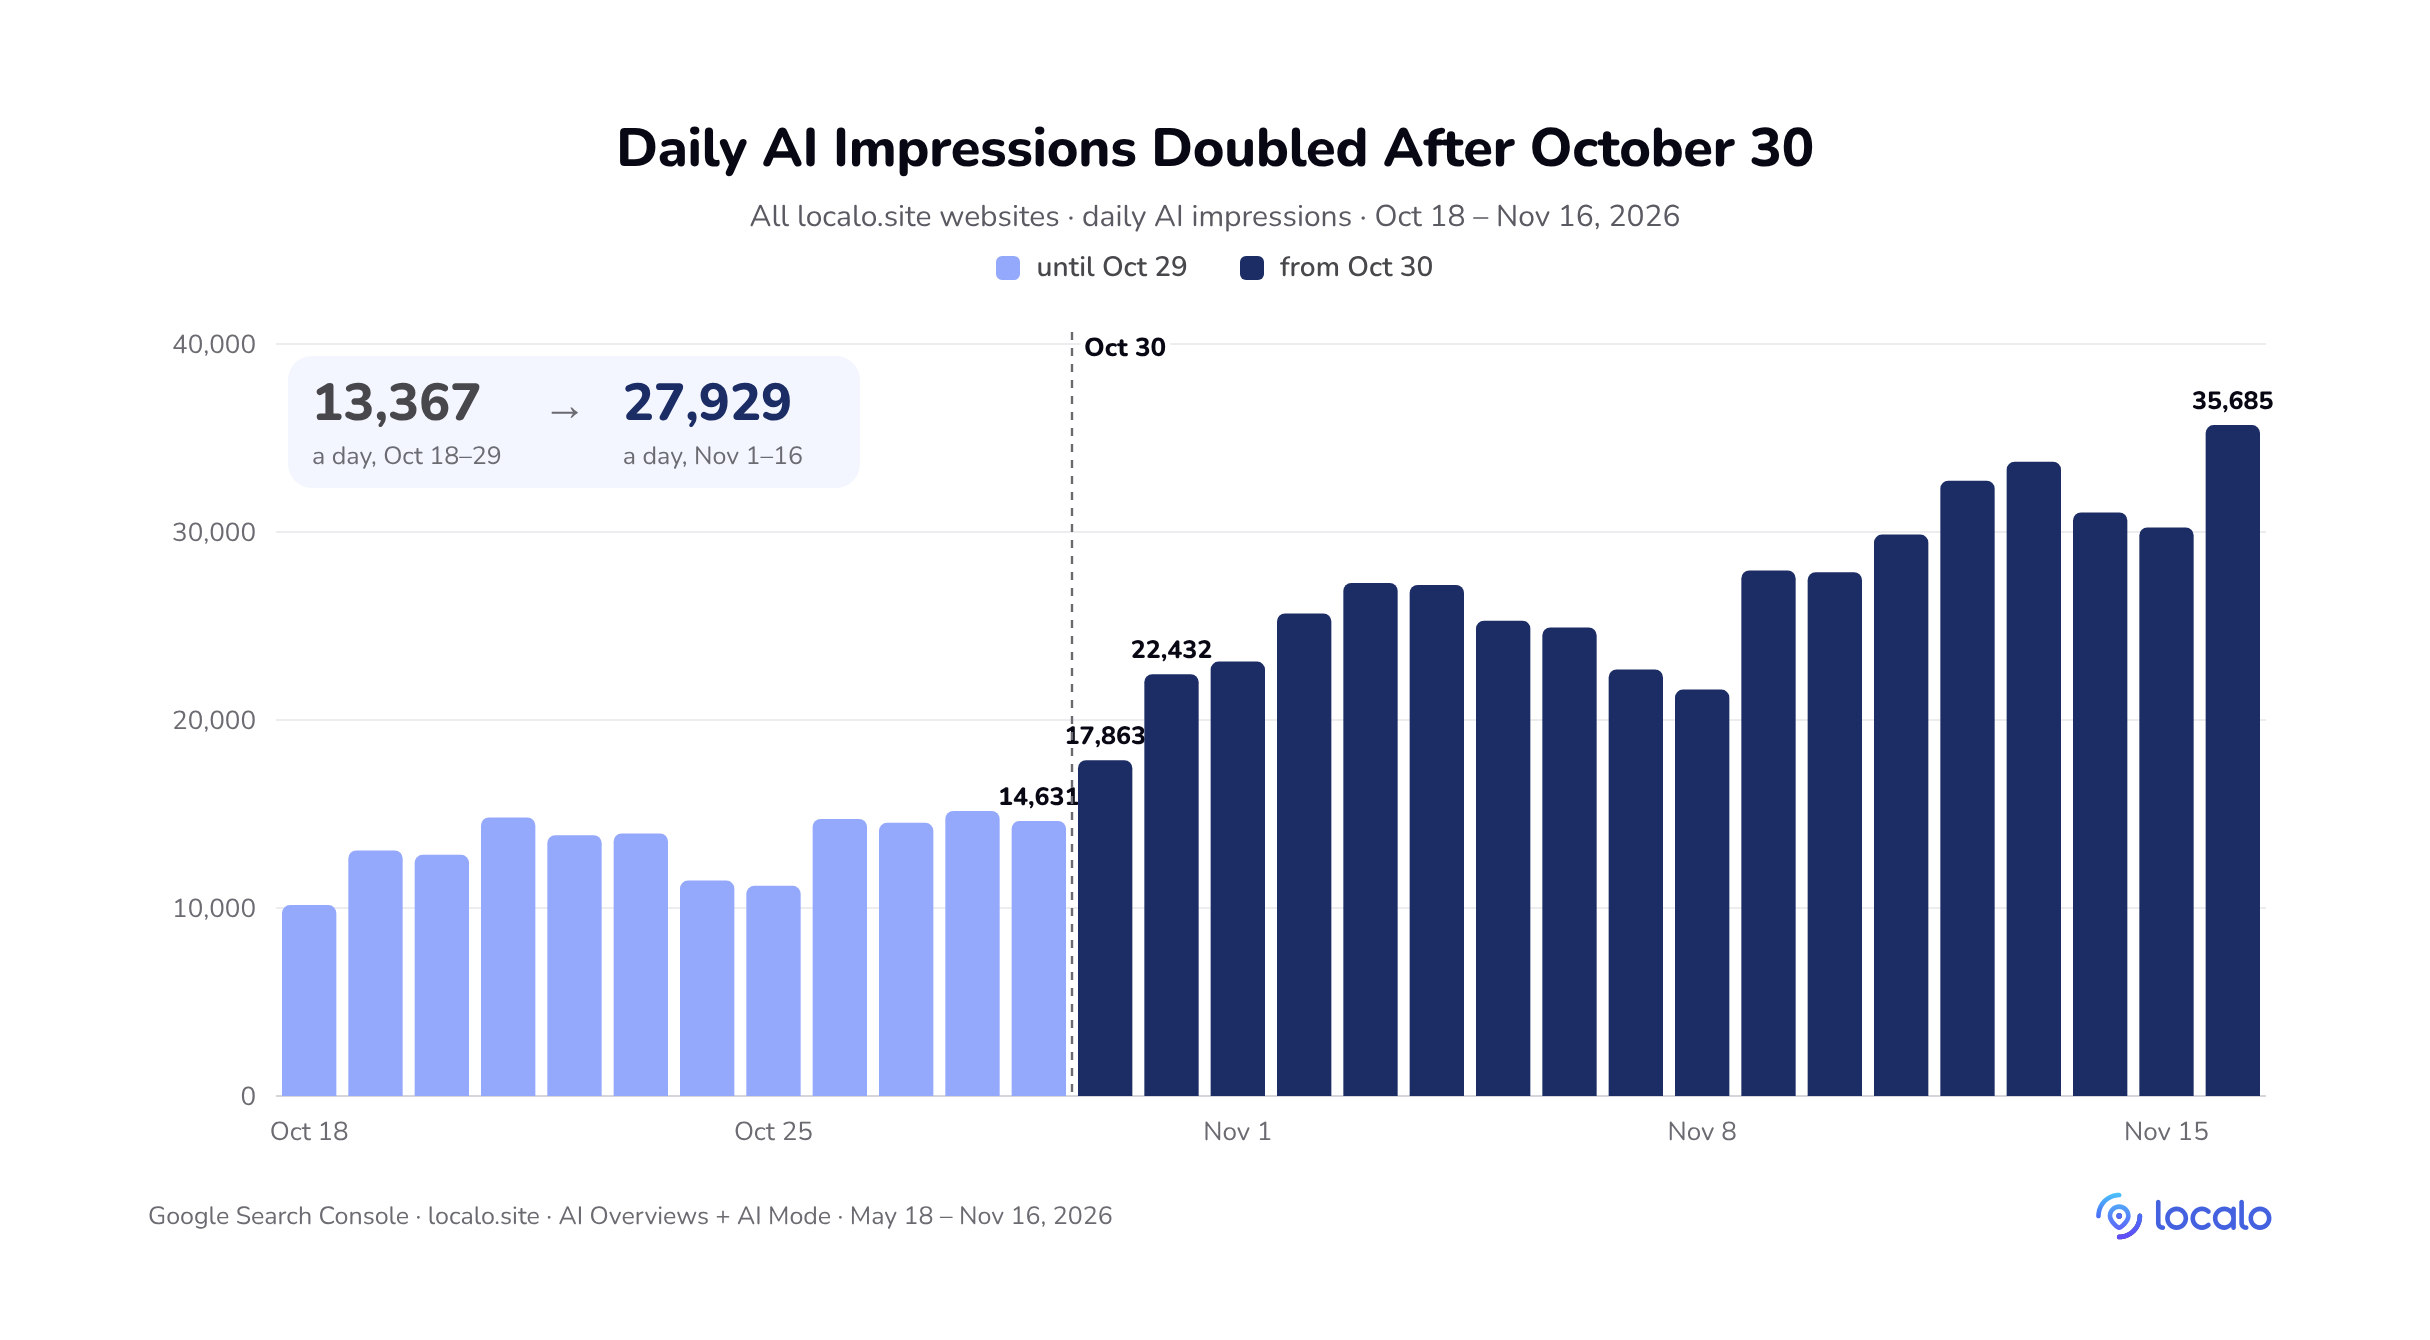
| Day or period | AI impressions per day |
|---|---|
| October 18–29 (average) | 13,367 |
| October 29 | 14,631 |
| October 30 | 17,863 |
| October 31 | 22,432 |
| November 1–16 (average) | 27,929 |
| November 16 | 35,685 |
The network’s combined AI impressions jumped within two days. Our daily data is a total for the whole network, so it doesn’t show how many websites the jump reached. Still, a jump this sudden in the combined data of hundreds of independent businesses more likely comes from a change on Google’s side than from anything the businesses did. On October 15, Google announced that links would appear more often and higher in AI responses (Google). Google gave no rollout dates by country and didn’t mention local businesses, so we can’t confirm that the jump came from that change.
A similar, smaller jump happened in September. In the week of September 14–20, the websites had an average of 15,126 AI impressions a day, 49% more than a week earlier (10,133). A week later, the average fell to 11,488. The October jump hasn’t faded, at least through November 16.
🔎 Key takeaway:
The jump came within two days in the network’s combined data, which more likely points to a change on Google’s side than to the work of individual businesses.
💡 Tip:
Before you credit your own work for a client’s AI growth in November, compare it with the network-wide jump of October 30–31.
AI Answers Show a Business Through Its Website or Its Business Profile
An AI answer can show a local business in two ways. It can cite the business’s website as a source, or it can show the business’s Google Business Profile with a button that leads to the website. The report counts both as an impression of the website. The URL can tell them apart if the profile’s website link has its own UTM tag.
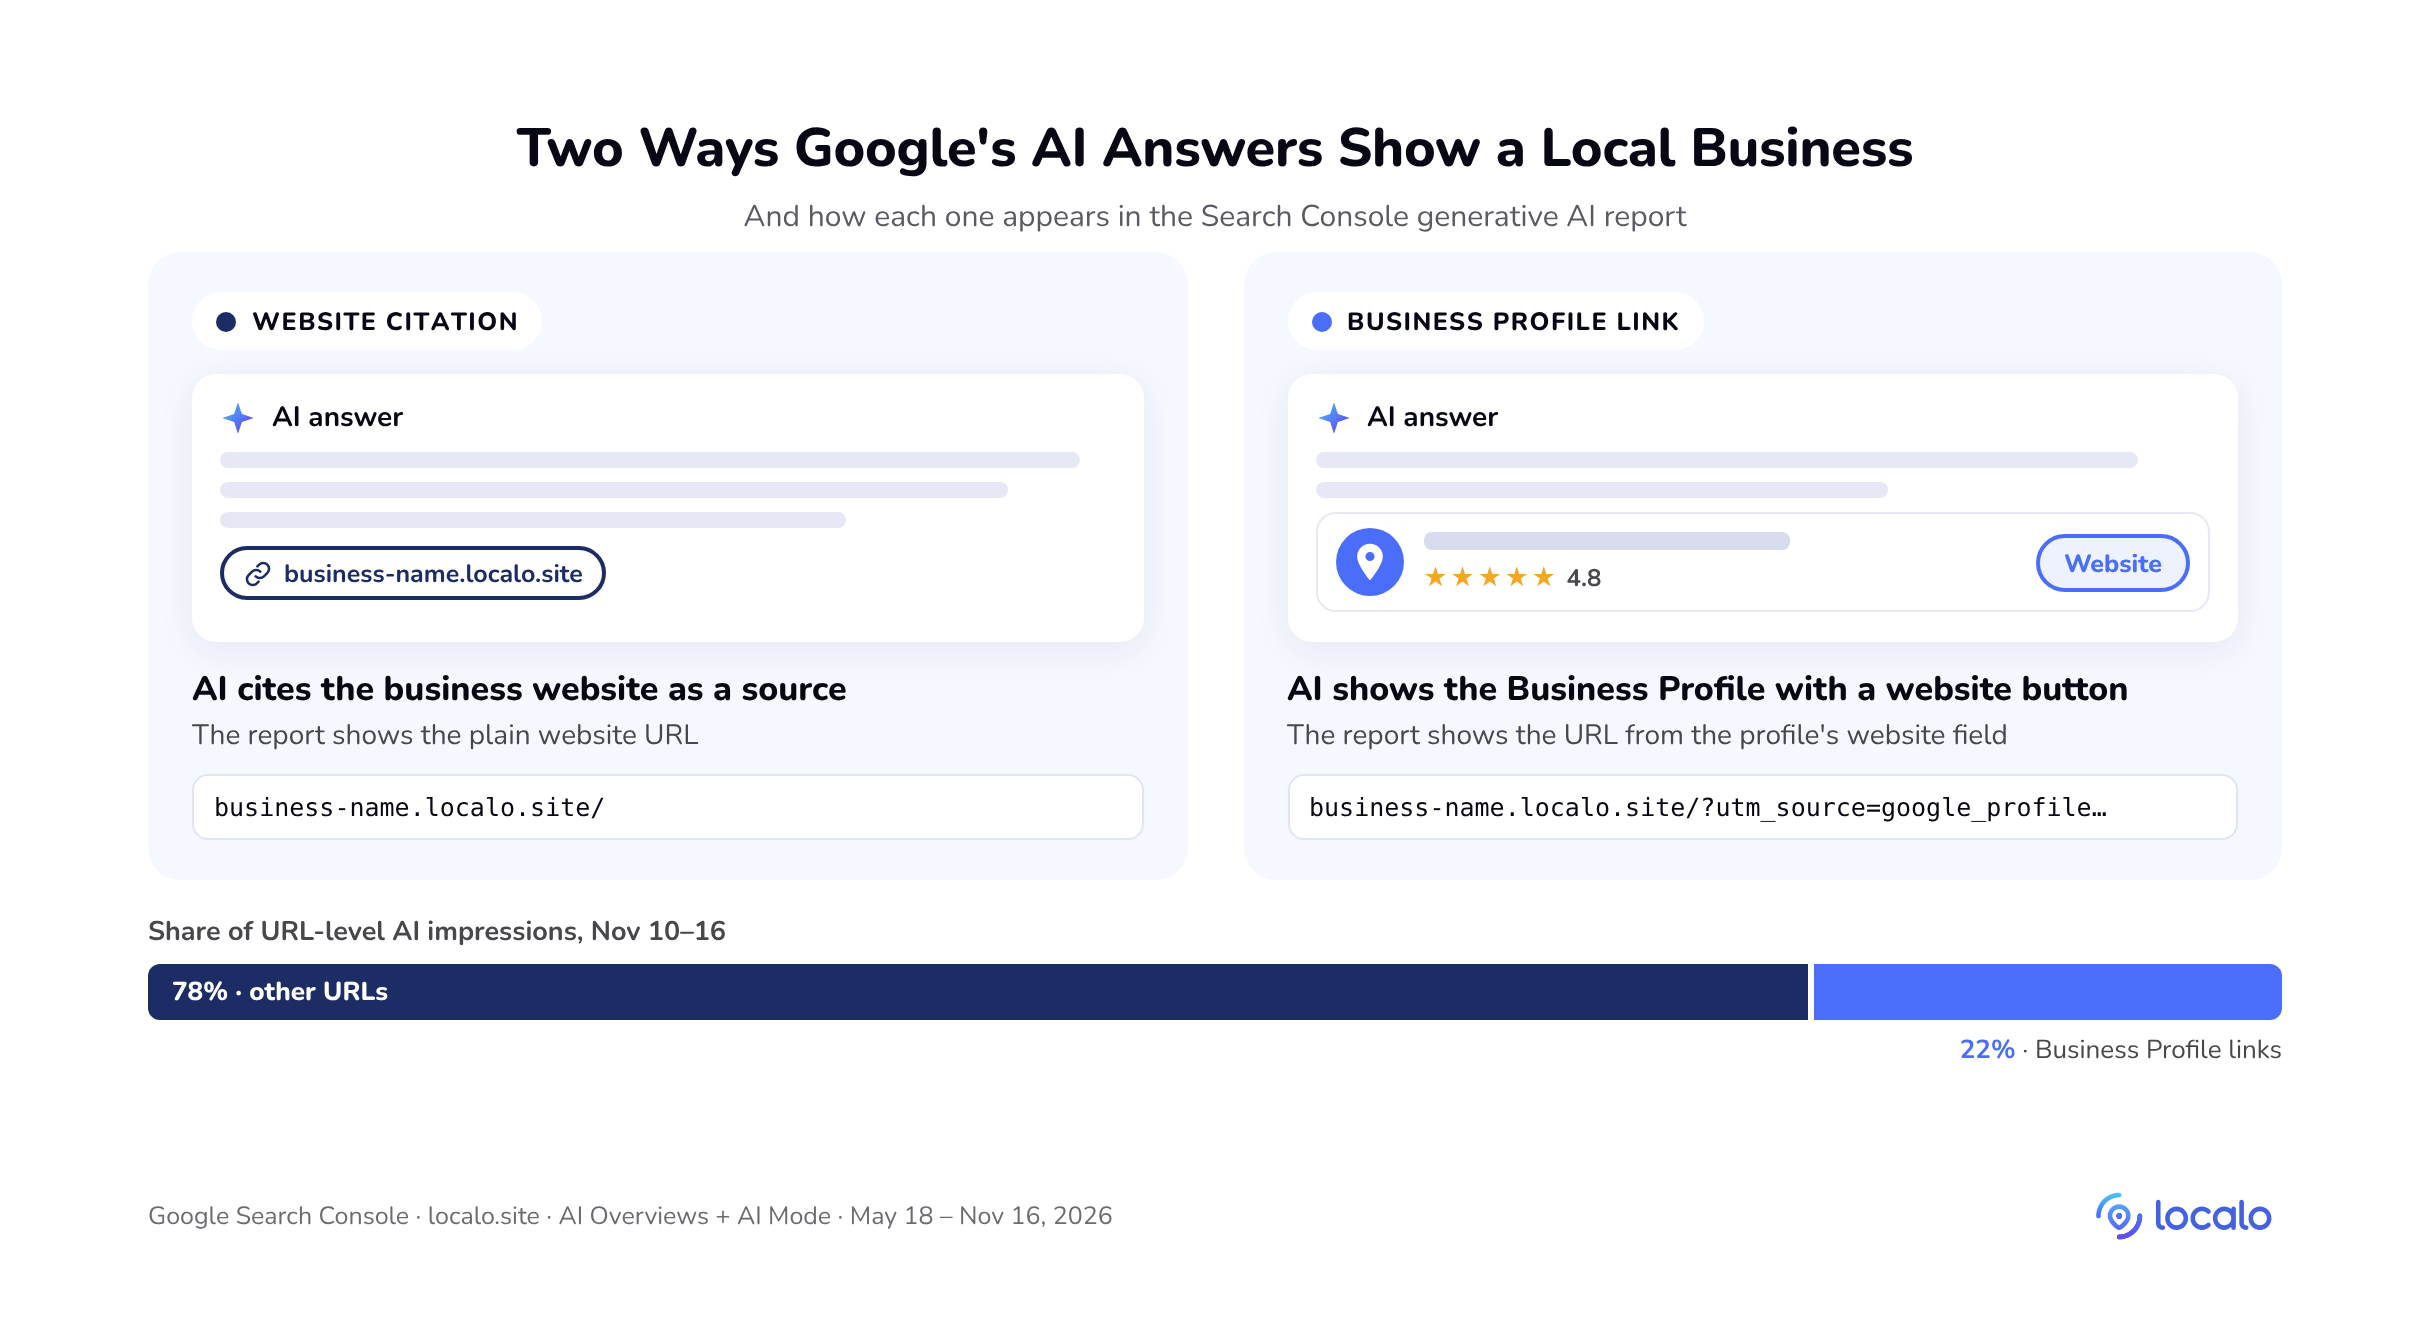
When a localo.site website is linked from a Business Profile, the link usually carries UTM tags, most often utm_source=google_profile&
| URL type | Oct 23–29, per day | Nov 10–16, per day | Change | Last 3 months vs previous 3 |
|---|---|---|---|---|
| Other URLs (no UTM) | 11,169 | 21,138 | 1.9x | 1.7x |
| Business Profile links (UTM) | 590 | 6,033 | 10.2x | 2.6x |
| Share of Business Profile links in URL-level data | 5% | 22% | +17 pp | 11.2% → 16.0% |
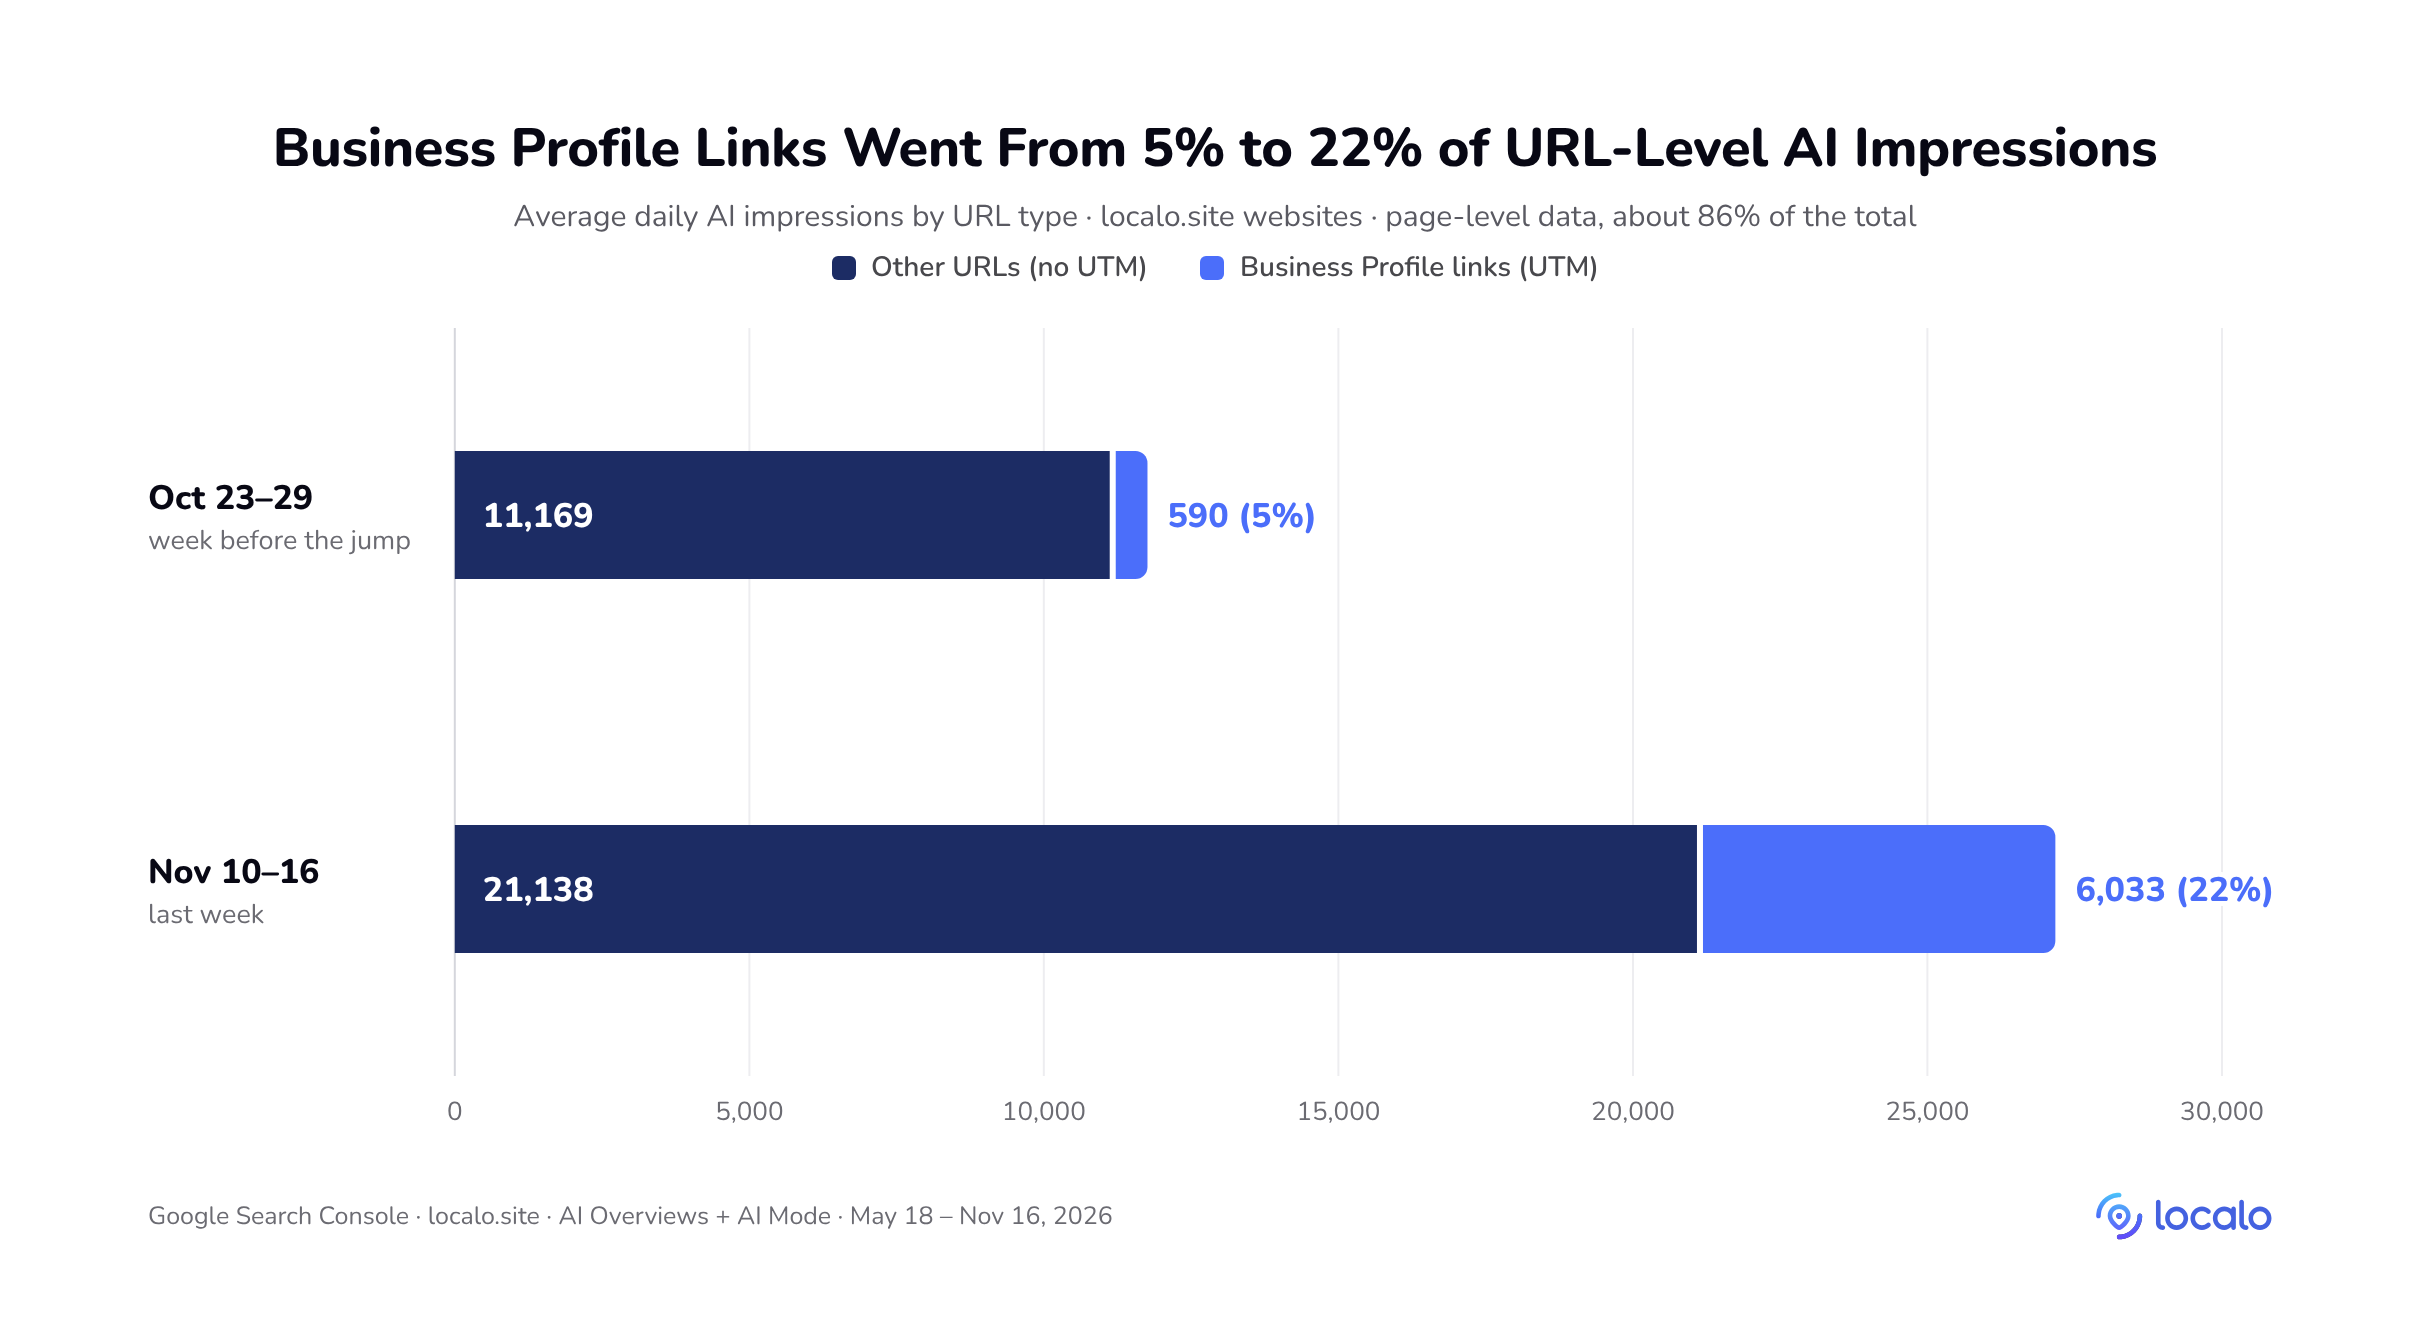
In the week before the jump (October 23–29), Business Profile links had an average of 590 AI impressions a day. In the last week (November 10–16), they had 6,033, or 10.2x more. Other URLs grew too, but more slowly: from 11,169 to 21,138 a day (1.9x). Among the impressions we could classify by URL, the share of Business Profile links rose from 5% to 22%. These page-level figures add up to about 86% of the property total, because Search Console counts a whole property and single pages differently.
The longer comparison points the same way. Among the most-viewed URLs, Business Profile links had 2.6x more AI impressions in the last three months than in the previous three, and other URLs had 1.7x more. This comparison covers the 1,000 most-viewed URLs of each period, 38–42% of all AI impressions. Together, they grew 1.8x, faster than the whole network (1.6x), so it describes only the most-viewed URLs.
🔎 Key takeaway:
Most AI impressions still go to other URLs, but Business Profile links grow fastest: from 5% to 22% of the impressions classified by URL within three weeks.
💡 Tip:
Add UTM parameters to the website link in every client profile, with a tag you use nowhere else. Without them, Search Console can’t separate the profile link from other URLs. Our UTM tracking guide shows how to set them up.
Websites Linked From the Business Profile Grew, the Others Mostly Fell
We then checked whether it matters that a website is linked from the Business Profile. We started from the localo.site websites in the list of the most-viewed URLs of the three-month comparison and kept the 1,066 that had been live for at least six months and could be matched with their Business Profiles in Localo. Then we compared their AI impressions in two periods: May 18–August 16 and August 17–November 16, 2026. In one group, the localo.site website was the profile’s website. In the other, the profile linked to a different website, which our data doesn’t cover.
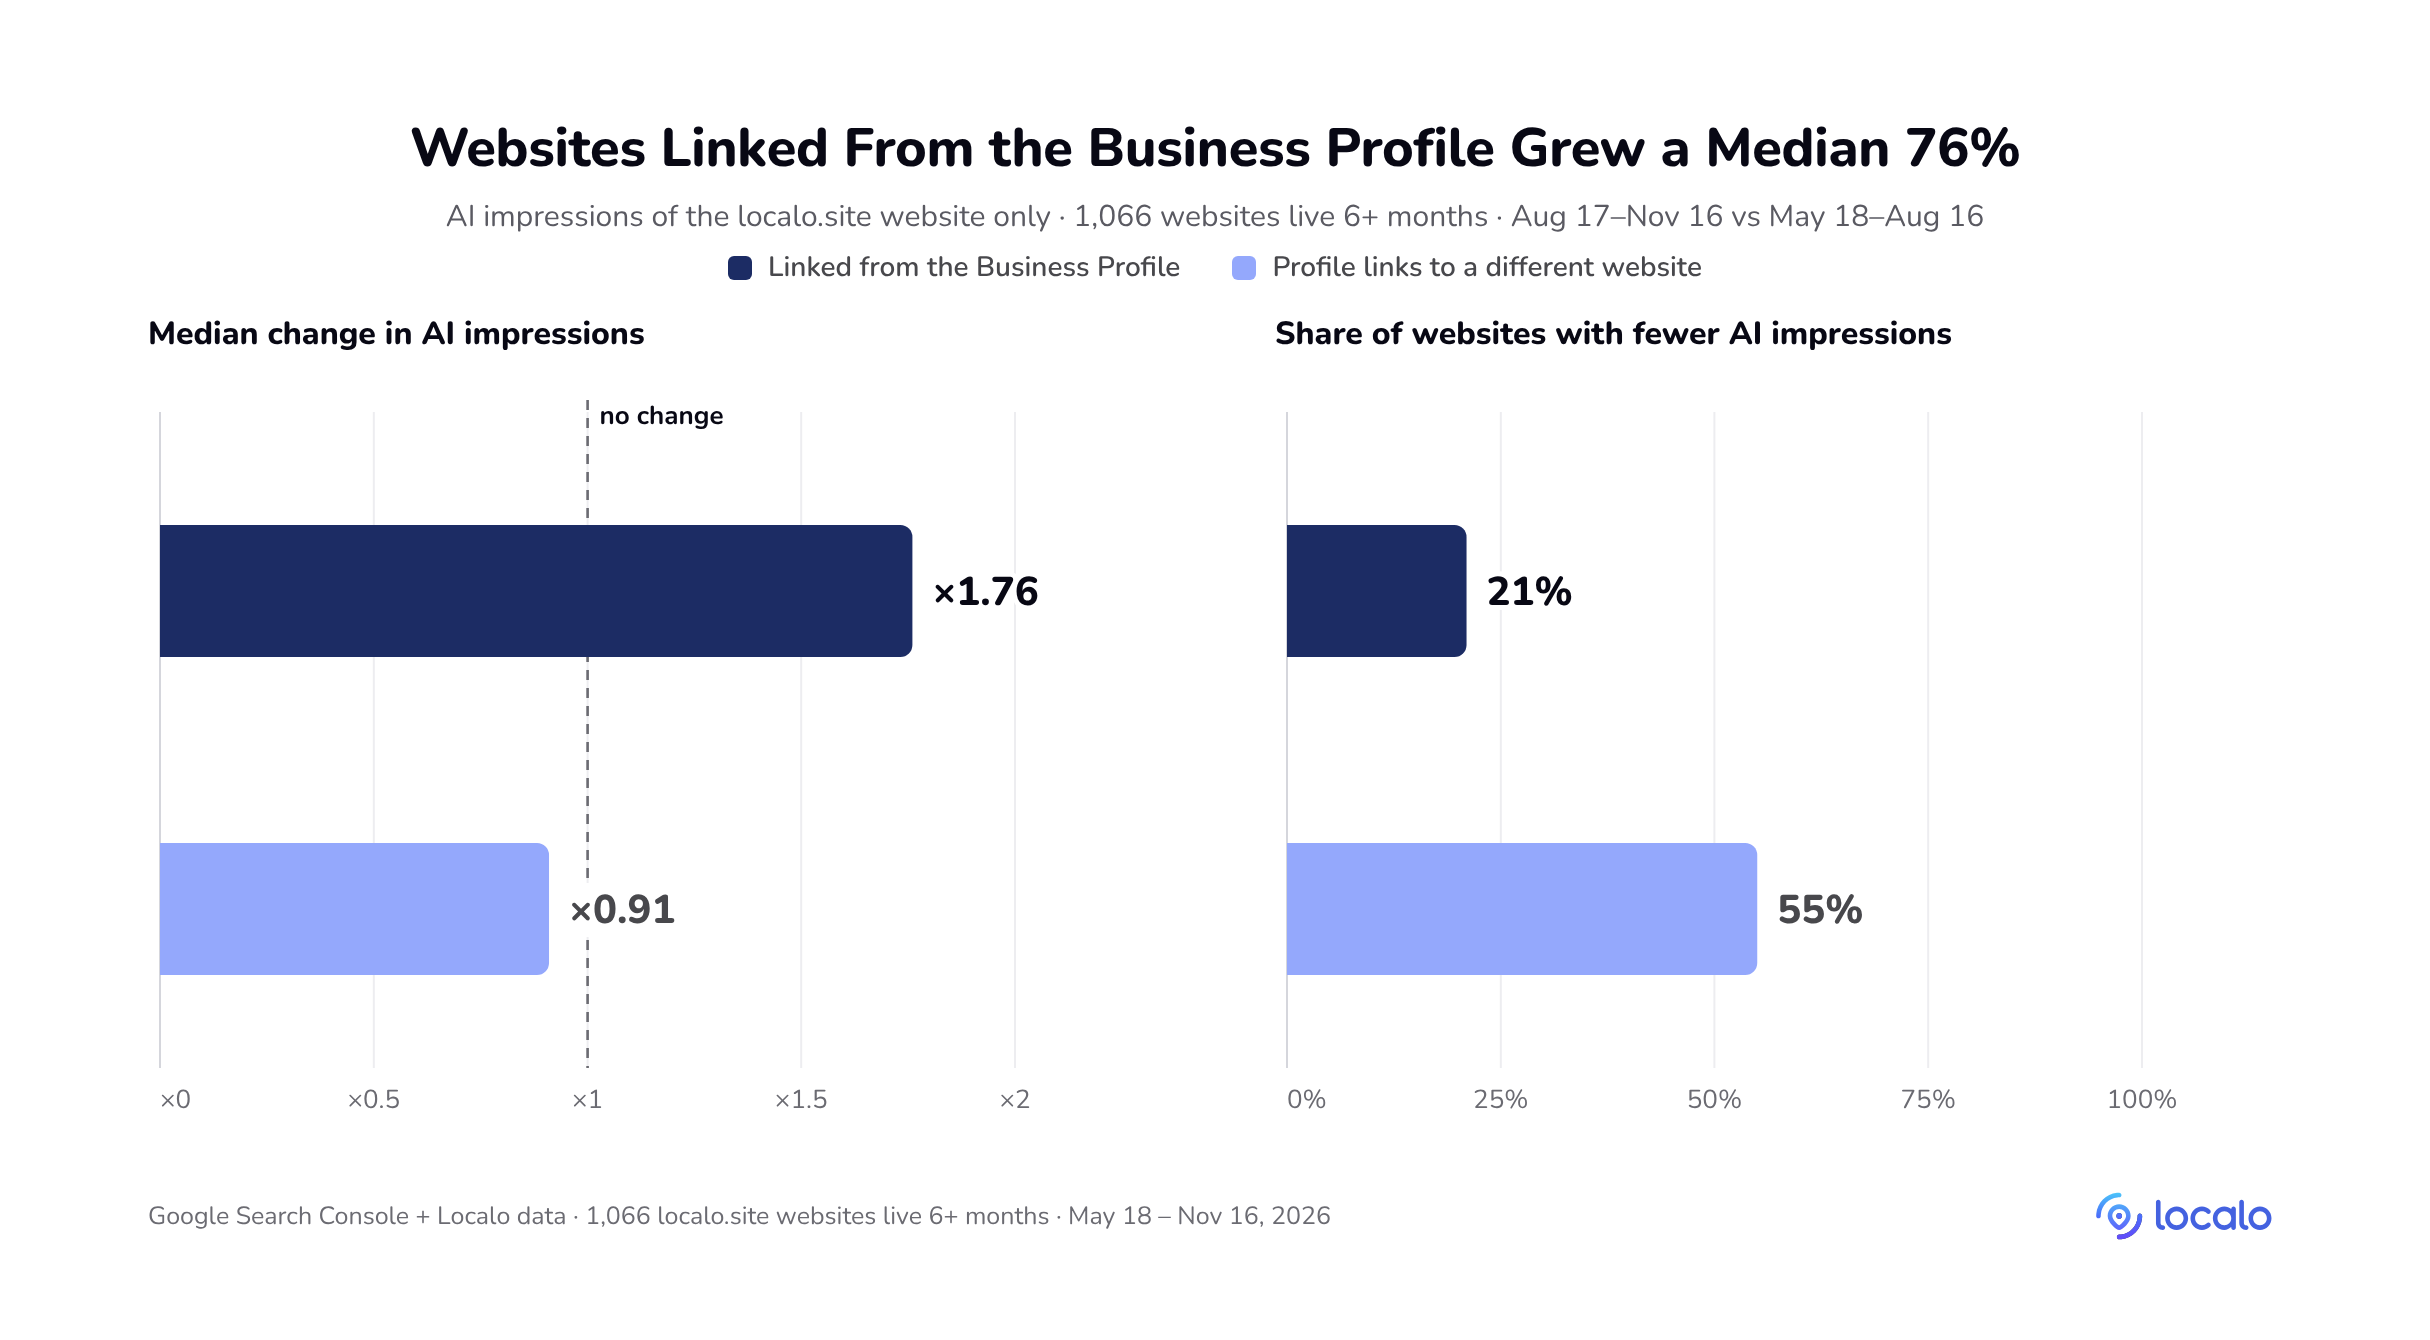
| Measure | Linked from the Business Profile | Profile links to a different website |
|---|---|---|
| Median change in AI impressions | ×1.76 (+76%) | ×0.91 (−9%) |
| Share of websites with fewer AI impressions | 21% | 55% |
A typical website linked from the profile gained 76% in AI impressions (median ×1.76). A typical website whose profile linked to a different site lost 9% (median ×0.91). AI impressions fell for 21% of the first group and for 55% of the second. Among the 25% of websites with the biggest growth, 74% were linked from the profile. Among websites with no growth or a decline, 33% were.
These figures cover impressions of localo.site websites only, not the businesses’ total visibility. When a profile links elsewhere, AI answers may show that other site instead, and we don’t see it. The result doesn’t mean that setting a localo.site website in the profile will by itself bring 76% more.
The groups follow today’s profile setting. For most profiles, we don’t know when the link was set, so a website that stopped being the profile’s website during the period counts in the second group. Both groups also come from the list of the most-viewed URLs, which grew faster than the whole network, so the medians describe the websites with the most AI impressions, not all localo.site websites.
After accounting for country and the starting number of impressions, a link from the profile went with about 64% more growth. To see where that difference comes from, we split the impressions by URL type. This uses a different selection from the same list: websites with at least 50 AI impressions in the first period, grouped by whether their Business Profile link appears in the data. For the 170 websites whose profile link appears, 78% of the increase in AI impressions came from that link. Their other URLs also grew faster than those of the other 960 websites: a median ×1.53, measured on the 78 websites with at least 50 impressions of other URLs at the start, vs ×1.24. That difference stays within the margin of error.
The data fits a simple mechanism: when Google’s AI shows a business, it often shows its Business Profile, and the profile links to the website set in it. The data doesn’t show that localo.site works better than other websites. Many businesses with localo.site in the profile have no other website.
🔎 Key takeaway:
In our data, AI answers showed the website linked from the Business Profile. Where the profile didn’t link to the localo.site website, that website gained little or lost AI impressions.
💡 Tip:
Check the website field in every client profile. If it’s empty or points to an outdated site, AI answers have no good page to show with the business.
Posts and Reviews Make Only a Small Difference
Among websites linked from the profile, we compared the 25% that grew fastest with those that didn’t grow. We looked for profile activities that clearly separate the two groups.
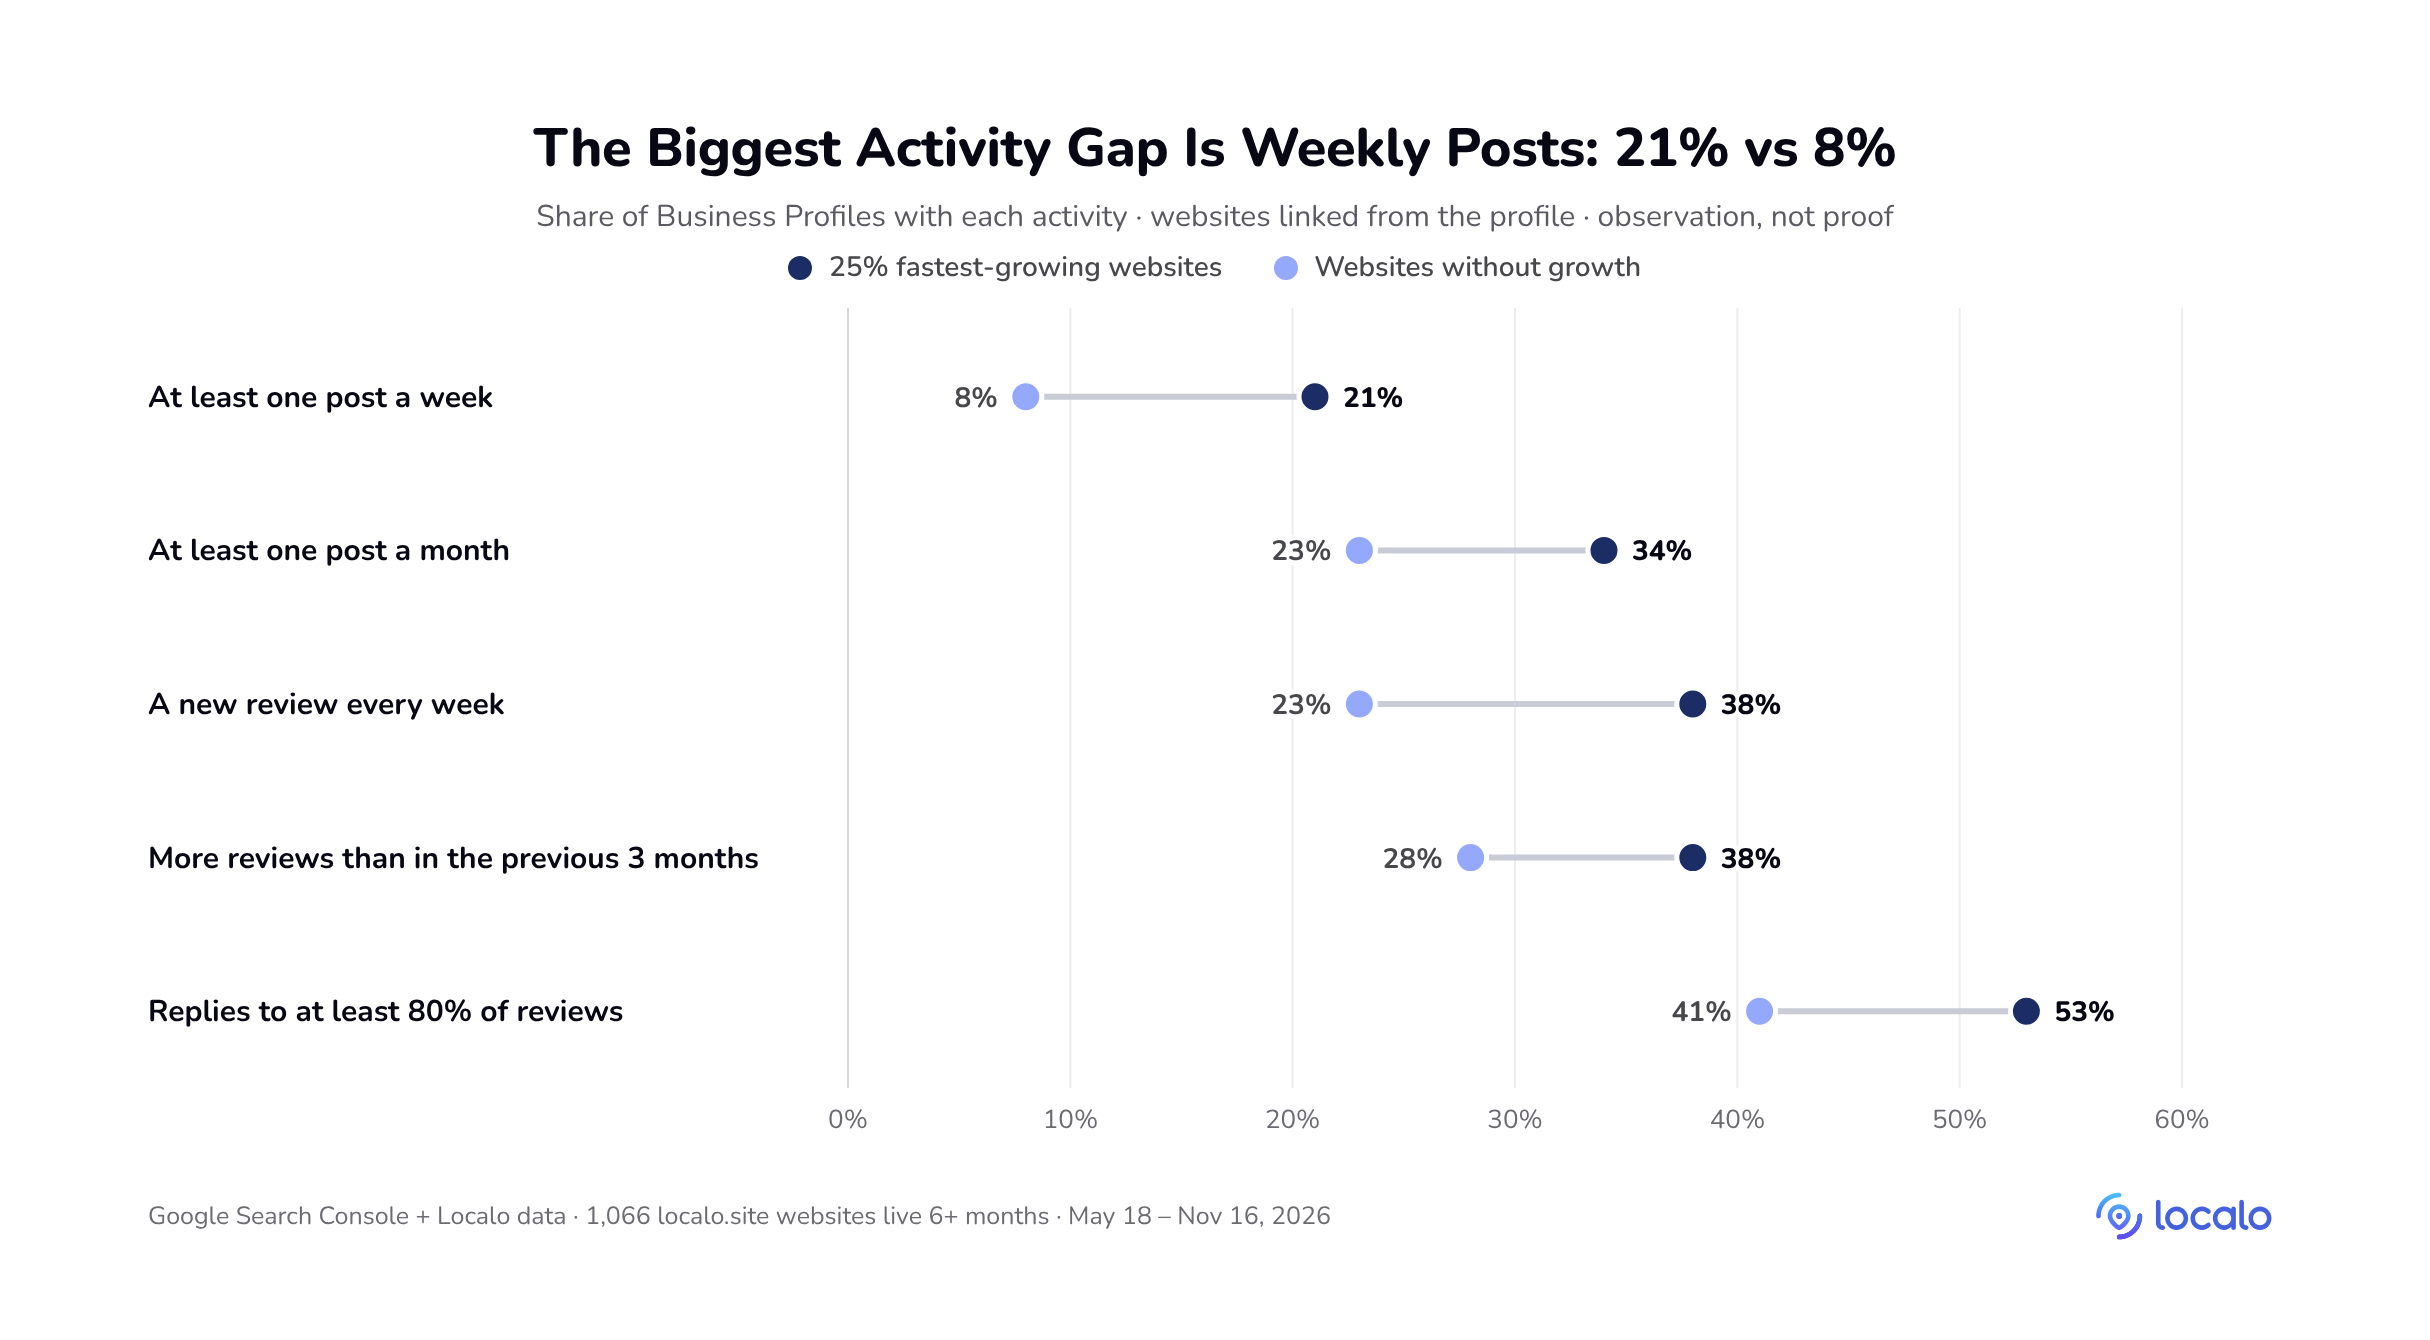
| Business Profile activity | 25% fastest-growing websites | Websites without growth |
|---|---|---|
| At least one post a week | 21% | 8% |
| At least one post a month | 34% | 23% |
| A new review every week | 38% | 23% |
| More reviews than in the previous 3 months | 38% | 28% |
| Replies to at least 80% of reviews | 53% | 41% |
Profiles of the fastest-growing websites posted more often, got new reviews more often and replied to more reviews. The same direction shows up separately in Poland and in India. In a model of all 1,066 websites that accounts for country, the profile link and the starting number of impressions, each of these activities went with about 10–20% more growth: about 17% for regular posts, about 20% for a new review every week and about 10% for replies, which is at the edge of noise. Offers, photos and the review link made no difference. Only 2% of these profiles posted to Facebook through Localo, too few to say anything.
None of the activities showed a large gap, such as 50% vs 5%. The biggest gap in activity is weekly posts: 21% vs 8%. Over 28-day windows, the activity gap got lost in the noise and only showed over three months. The direction of cause is also unclear: a business with more customers gets more reviews and probably more AI impressions, so reviews can be an effect rather than a cause.
🔎 Key takeaway (observation):
Regular posts and a steady flow of reviews go with slightly faster growth, about 10–20%. The differences are small and may partly reflect how many customers a business has.
💡 Tip:
Keep Business Profile posts and review requests on a steady schedule, because customers read them. Don’t present them to clients as the way into AI answers.
How Countries Compare
The localo.site network is international. AI impressions came from 230 countries, but the top 10 brought 87% of them. India (26.8%) and Poland (26.4%) had the most.
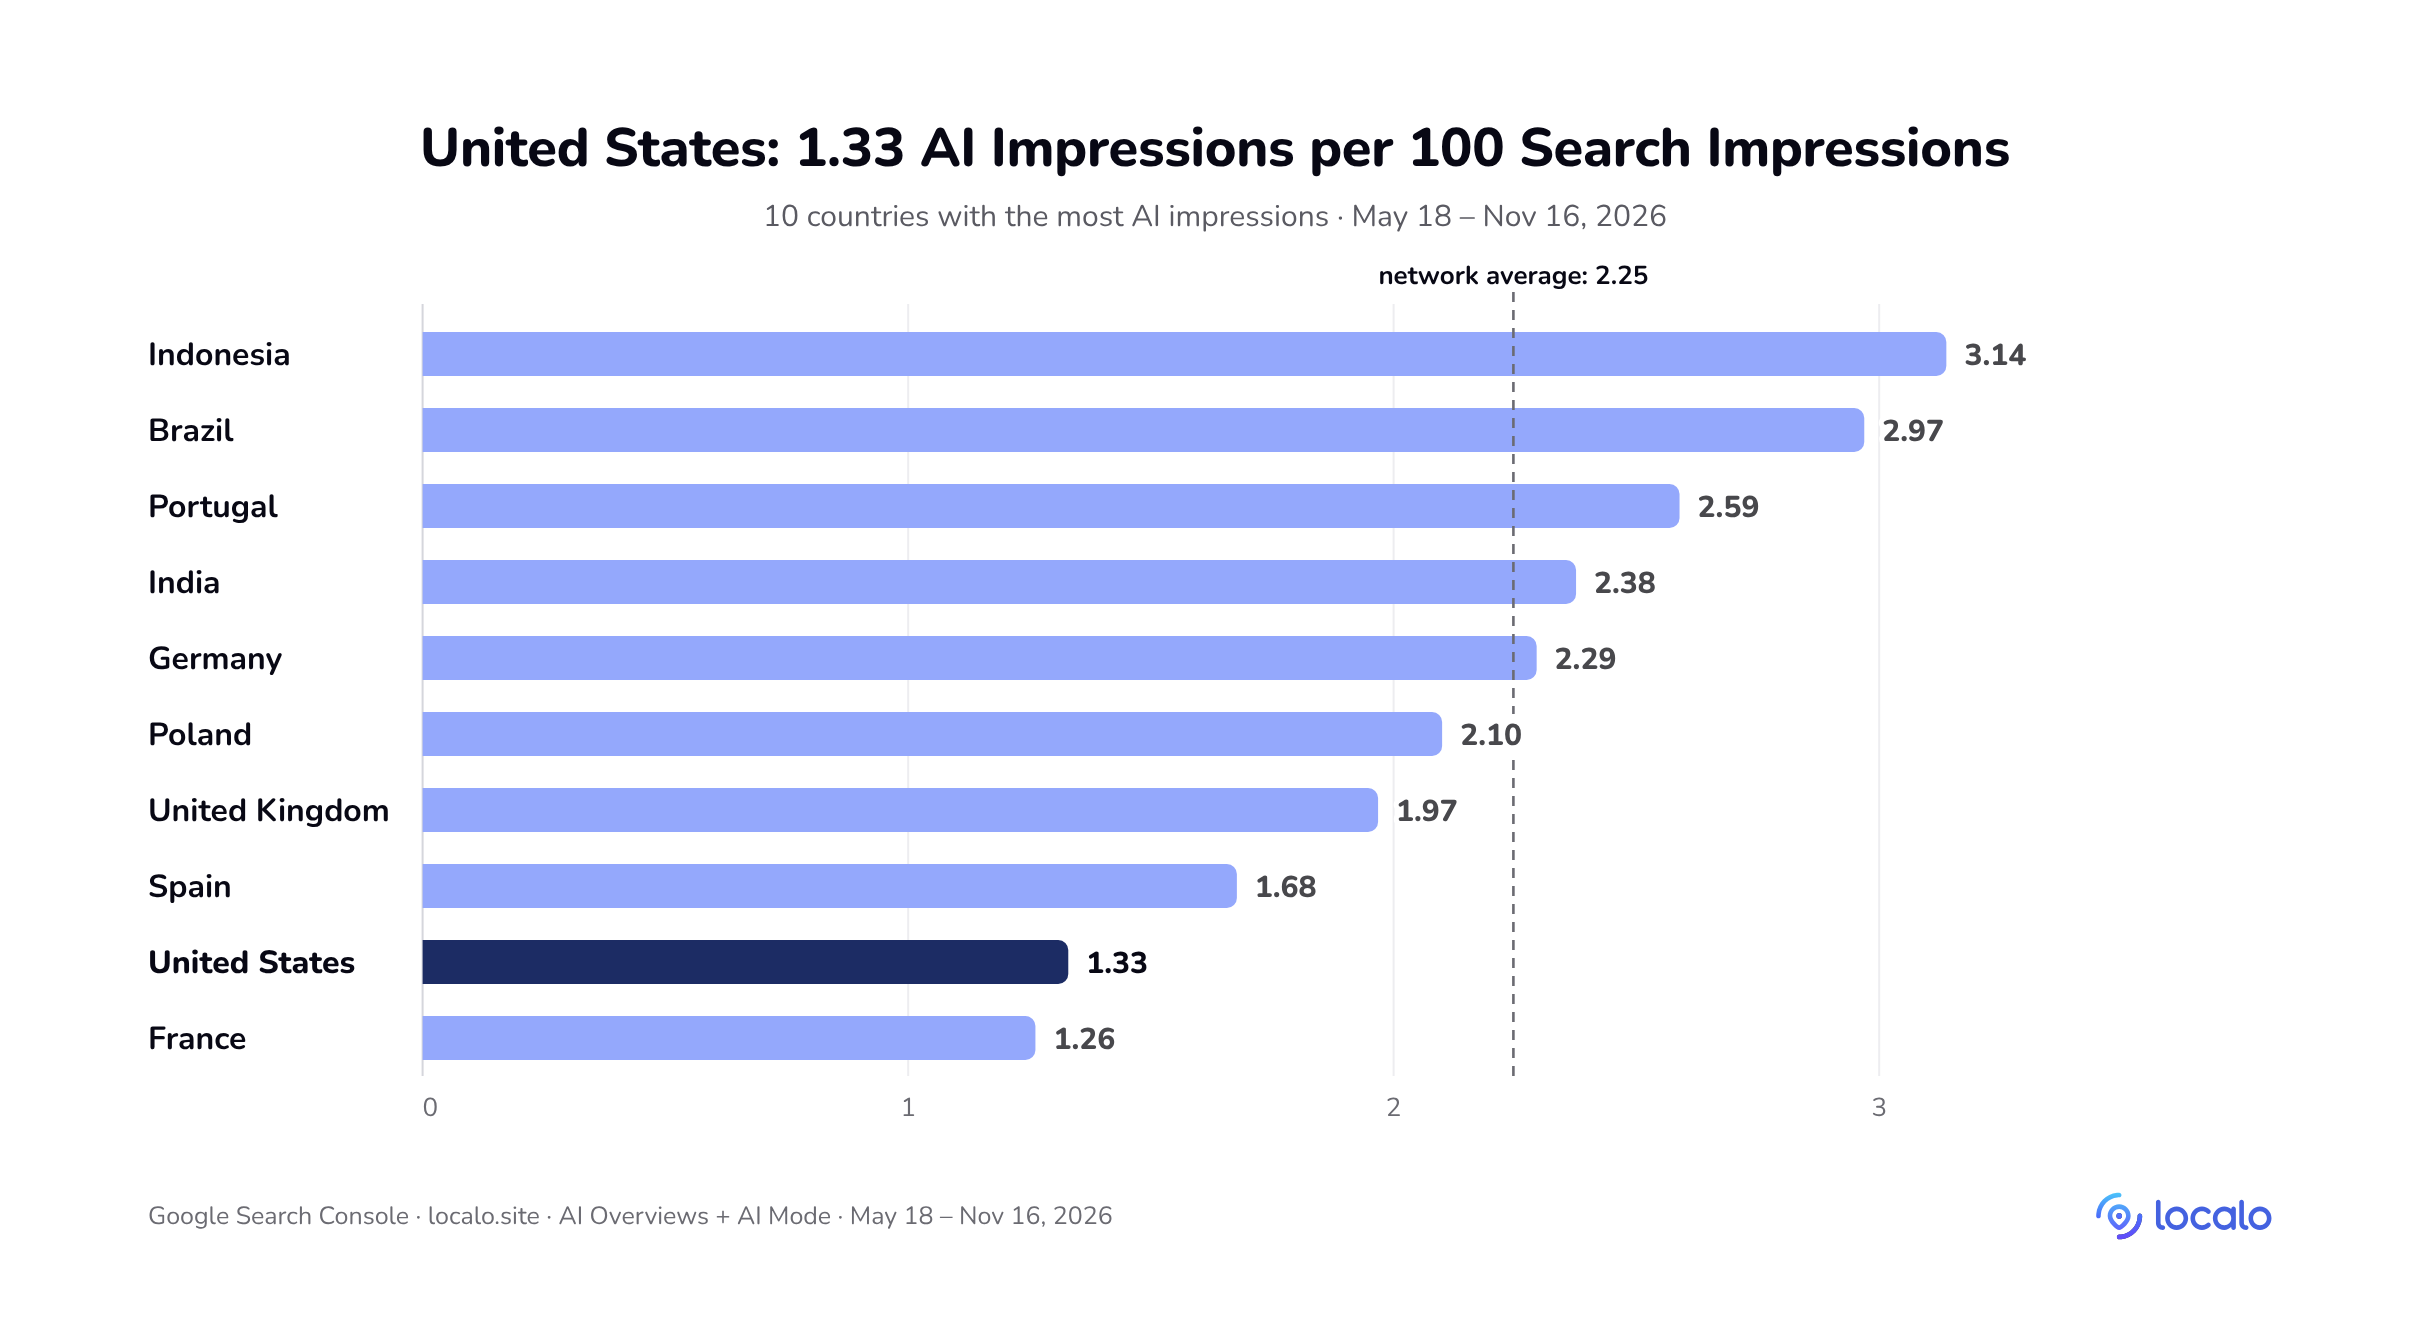
| Country | AI impressions | Share of all AI impressions | AI impressions per 100 search impressions | Last 3 months vs previous 3 |
|---|---|---|---|---|
| India | 571,472 | 26.8% | 2.38 | 1.8x |
| Poland | 562,840 | 26.4% | 2.10 | 1.5x |
| Brazil | 252,665 | 11.8% | 2.97 | 1.2x |
| Indonesia | 107,713 | 5.0% | 3.14 | 2.1x |
| United States | 98,249 | 4.6% | 1.33 | 1.4x |
| Portugal | 82,875 | 3.9% | 2.59 | 2.2x |
| Germany | 54,046 | 2.5% | 2.29 | 1.5x |
| Spain | 42,638 | 2.0% | 1.68 | 1.5x |
| France | 39,610 | 1.9% | 1.26 | 7.3x |
| United Kingdom | 34,795 | 1.6% | 1.97 | 1.7x |
In the United States, there were 1.33 AI impressions per 100 search impressions, well below the network average of 2.25. In the United Kingdom, there were 1.97. Indonesia (3.14) and Brazil (2.97) had the highest ratio, and France (1.26) the lowest.
France is a good test of the data. AI Overviews and AI Mode launched there only on July 22, 2026 (Google France). In the last three months, localo.site websites in France had 7.3x more AI impressions than in the previous three months, the biggest growth among the 10 countries. Most of it comes from the launch date: the earlier period had only 26 days with AI answers in France, the later one 92. Per day with AI answers, France grew about 2.1x, close to Indonesia (2.1x) and Portugal (2.2x). The United States grew 1.4x, and the whole network 1.6x. France’s low ratio for the full period also comes from the late launch.
🔎 Key takeaway:
AI impressions follow Google’s rollout country by country. The United States sits below the network average.
Phones Bring 69% of AI Impressions, the Same as Search
Phones brought 69.0% of AI impressions, almost the same share as in the Search results report (69.4%). They had 2.23 AI impressions per 100 search impressions, and computers had 2.26.
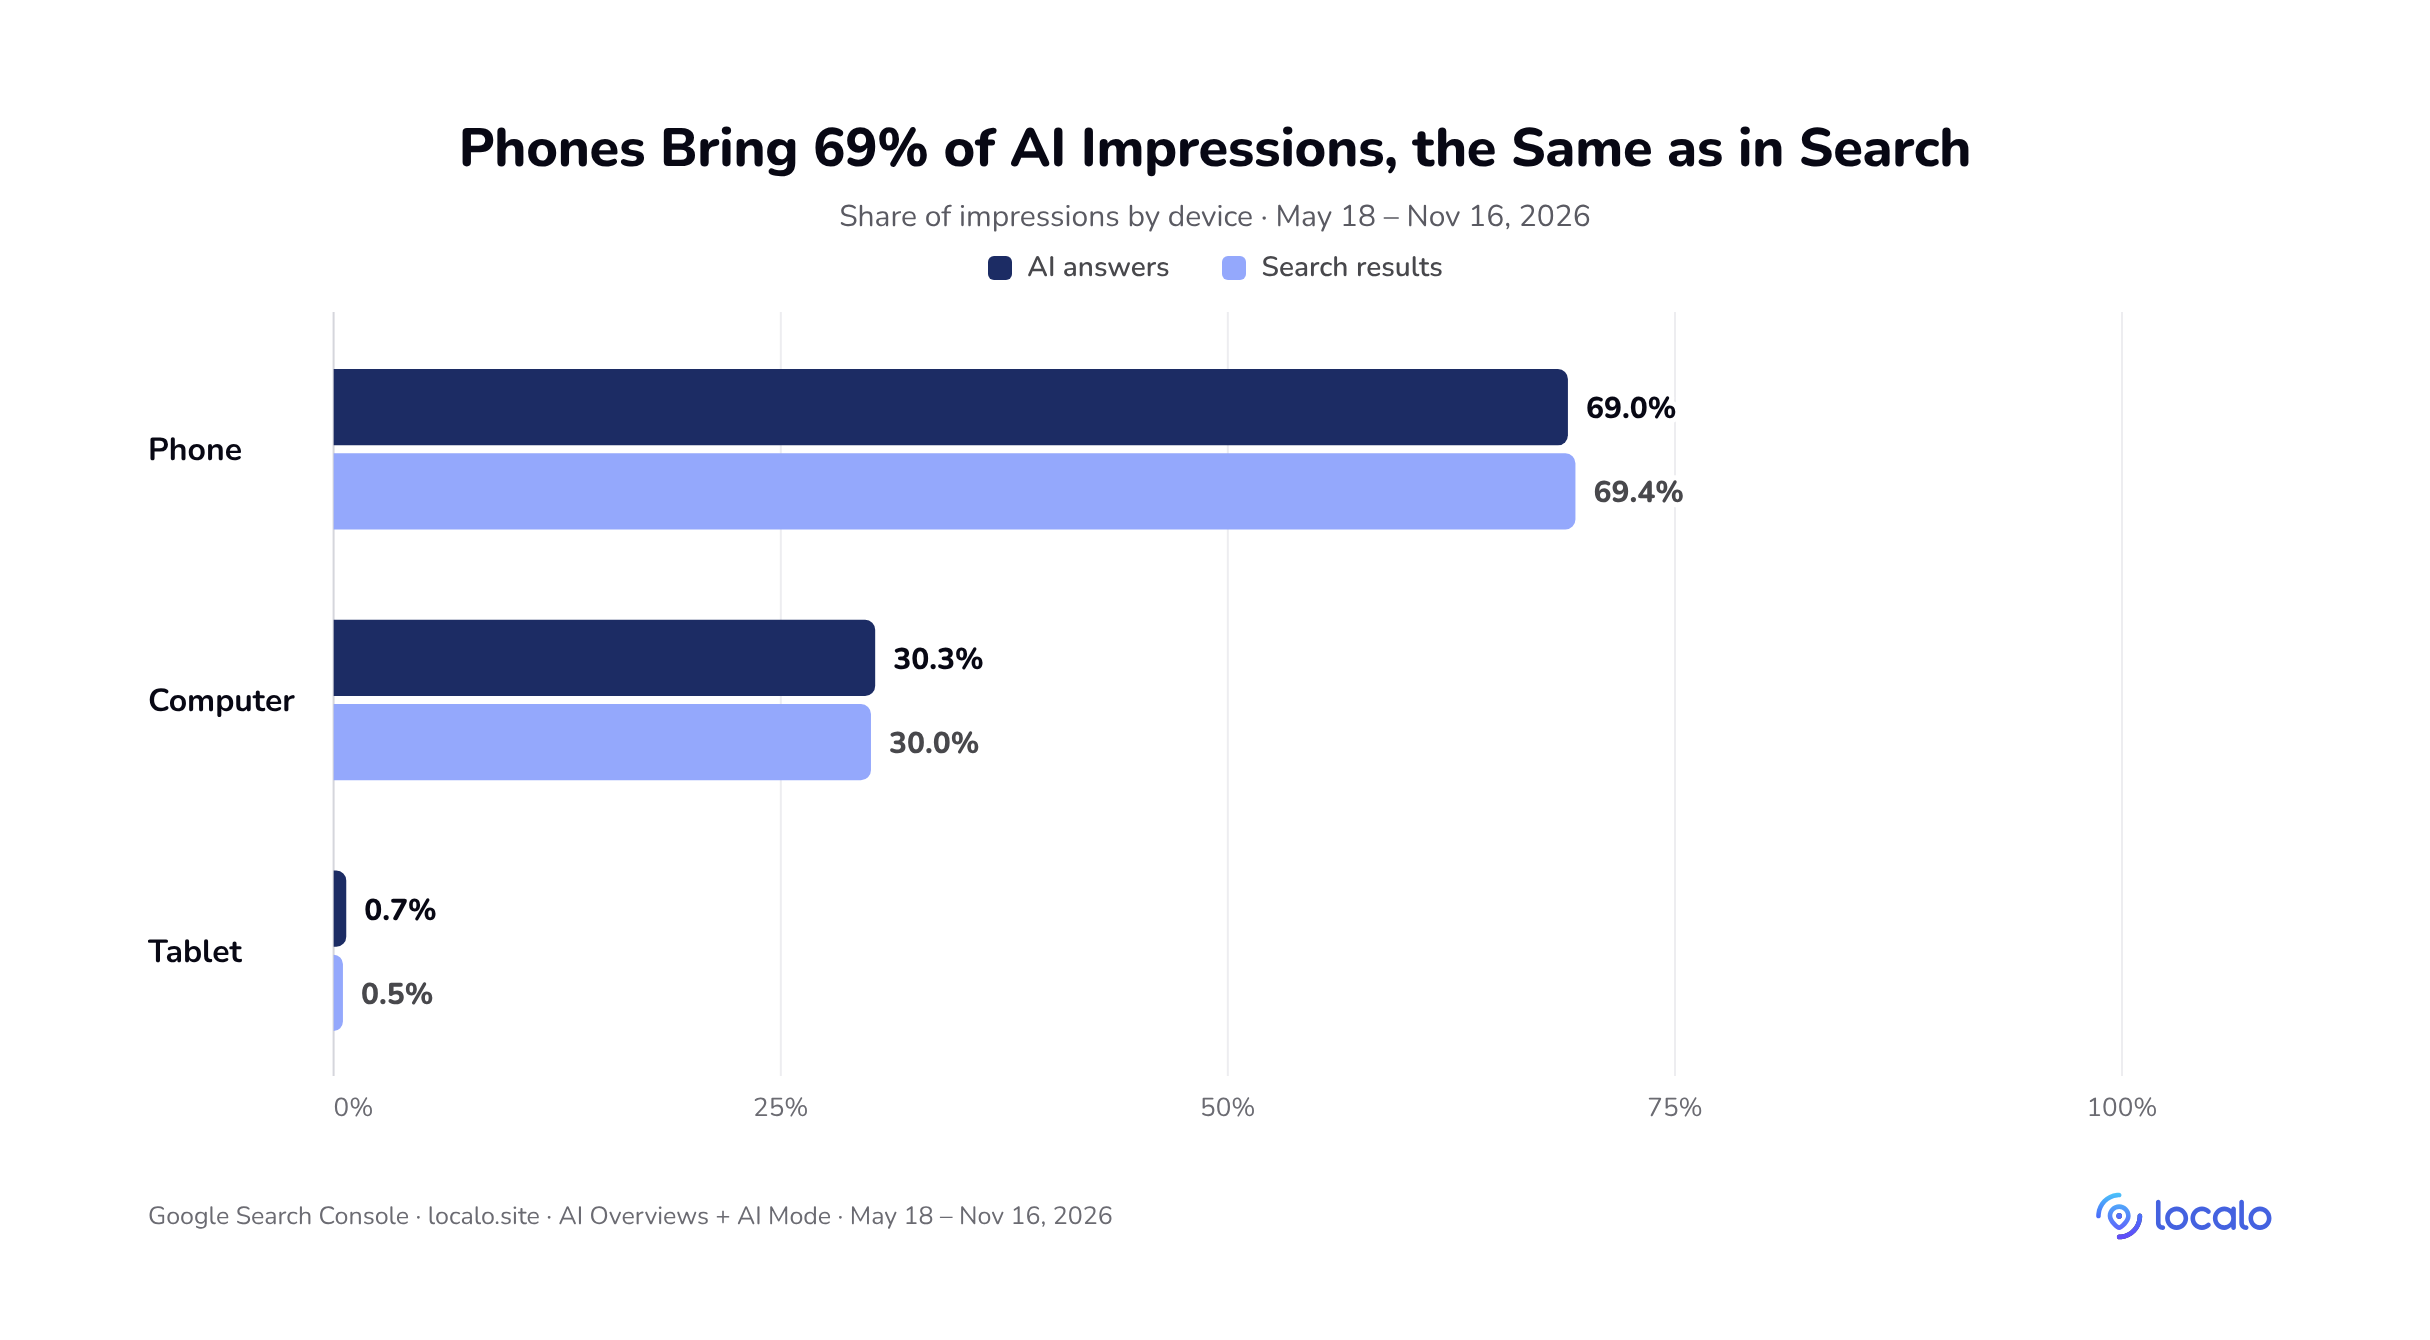
🔎 Key takeaway (observation):
The device split is the same in AI answers and in search, so the mobile version of a client’s website matters as much as ever.
AI Answers Show the Home Page, Across Thousands of Businesses
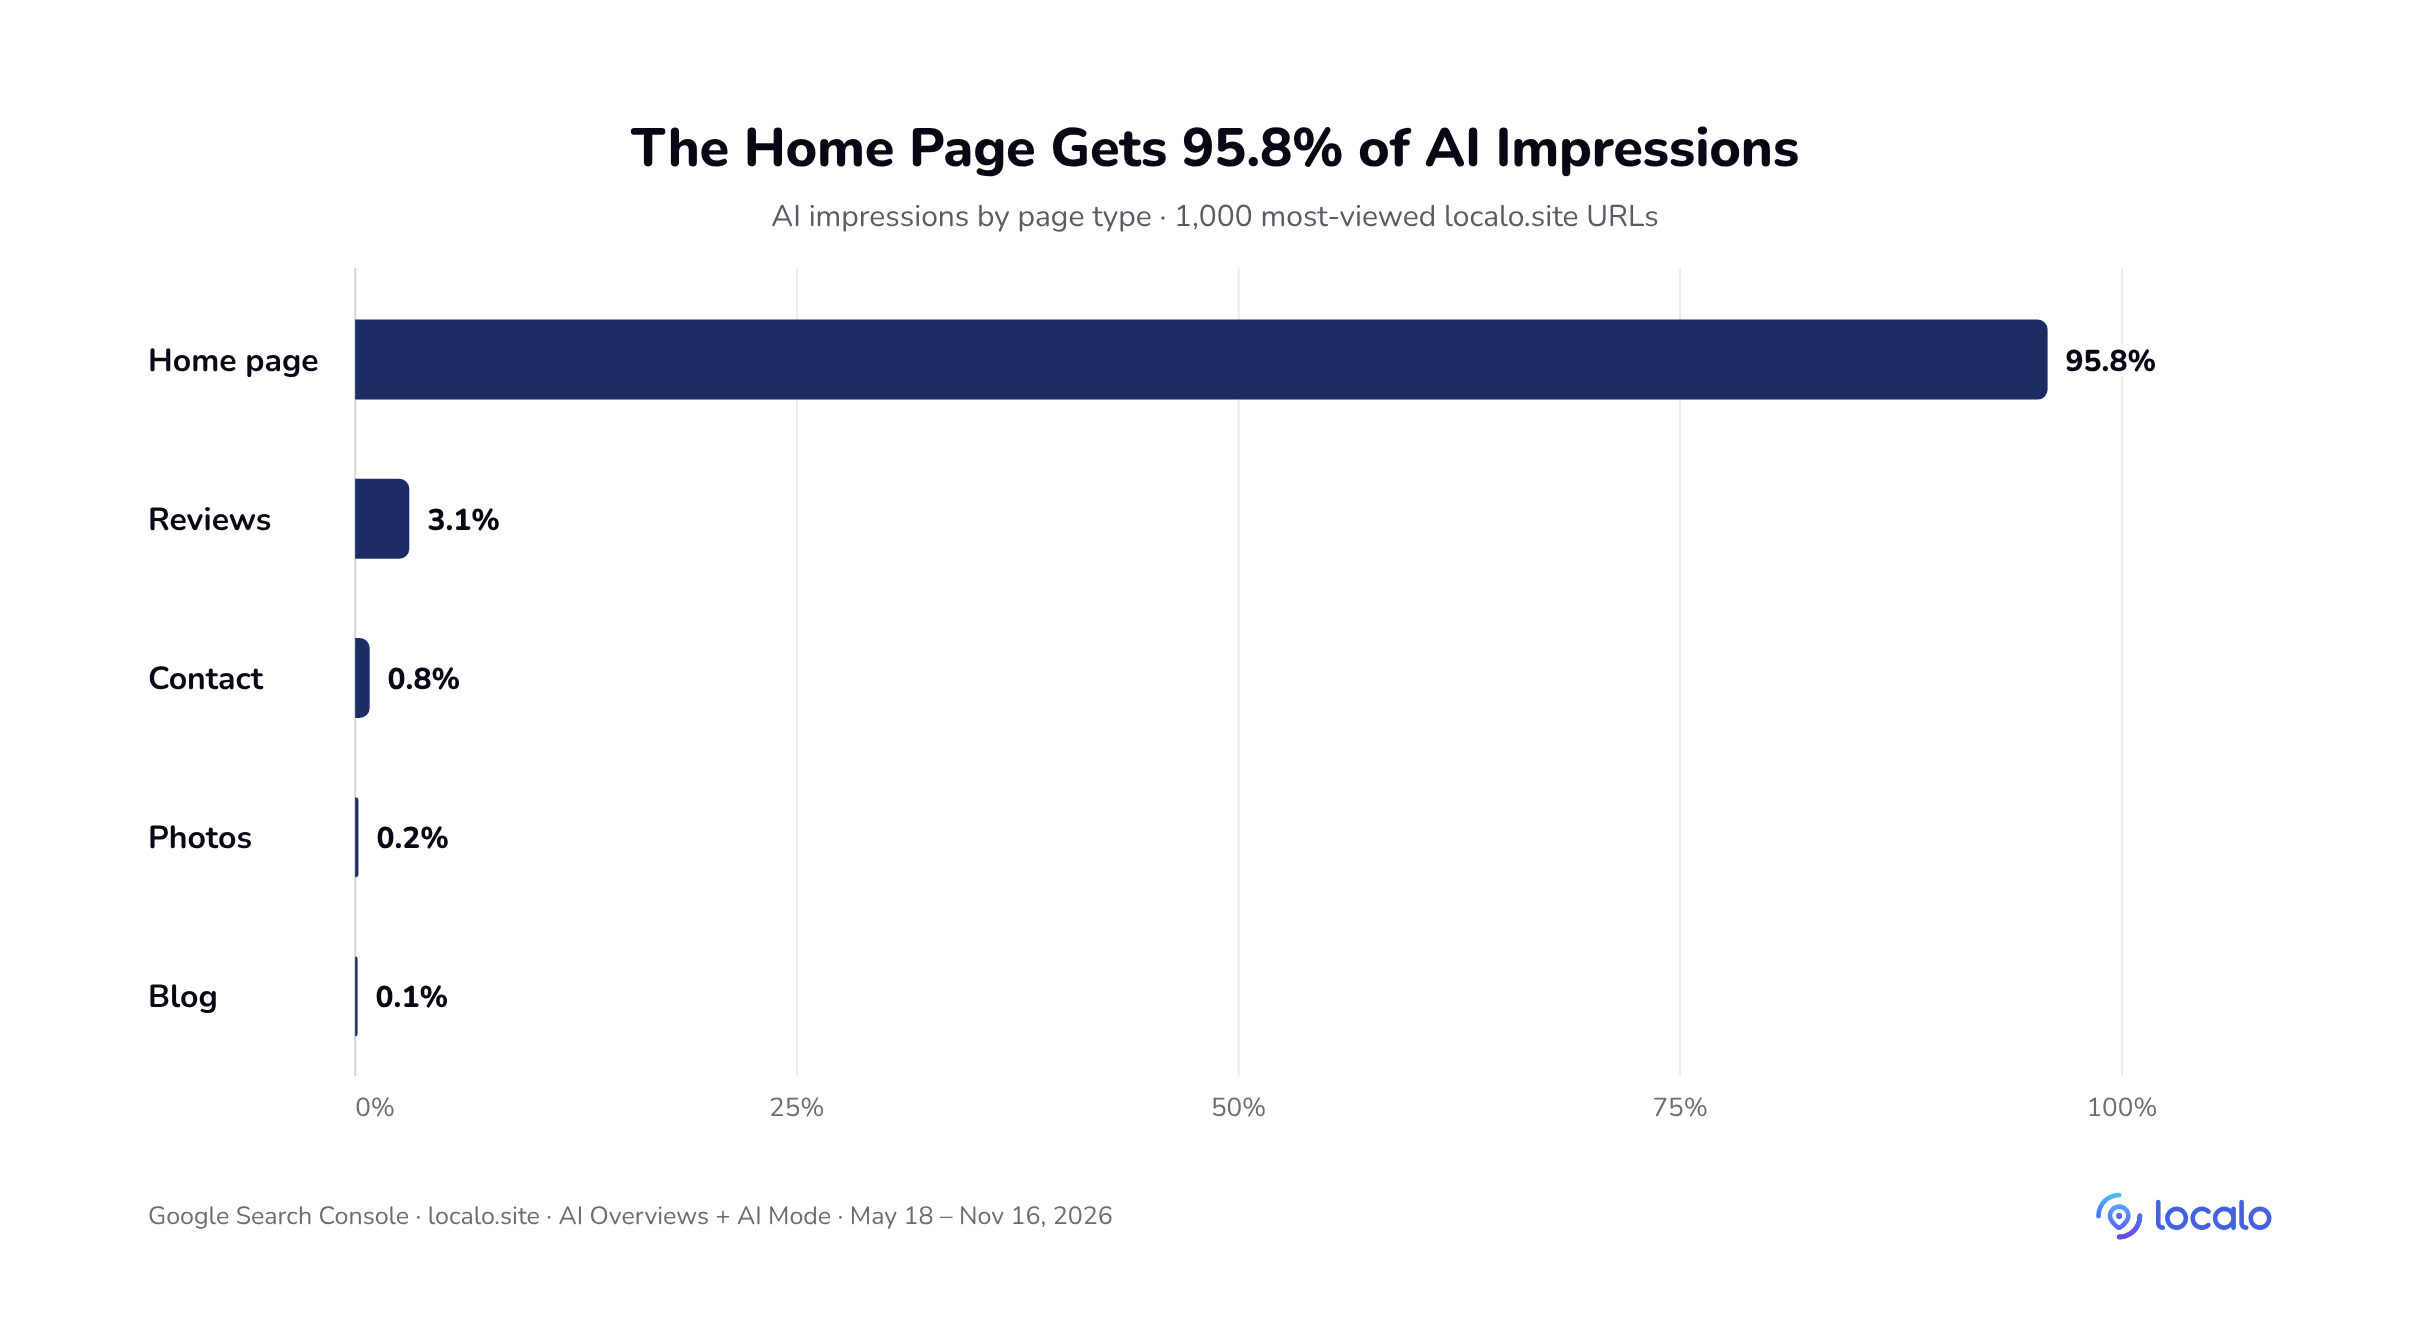
AI answers cite mainly the home page. Among the 1,000 most-viewed URLs, the home page had 95.8% of AI impressions, including Business Profile links, which also lead to the home page. Without those links, its share is 95.1%. The reviews subpage had 3.1% and the contact page 0.8%.
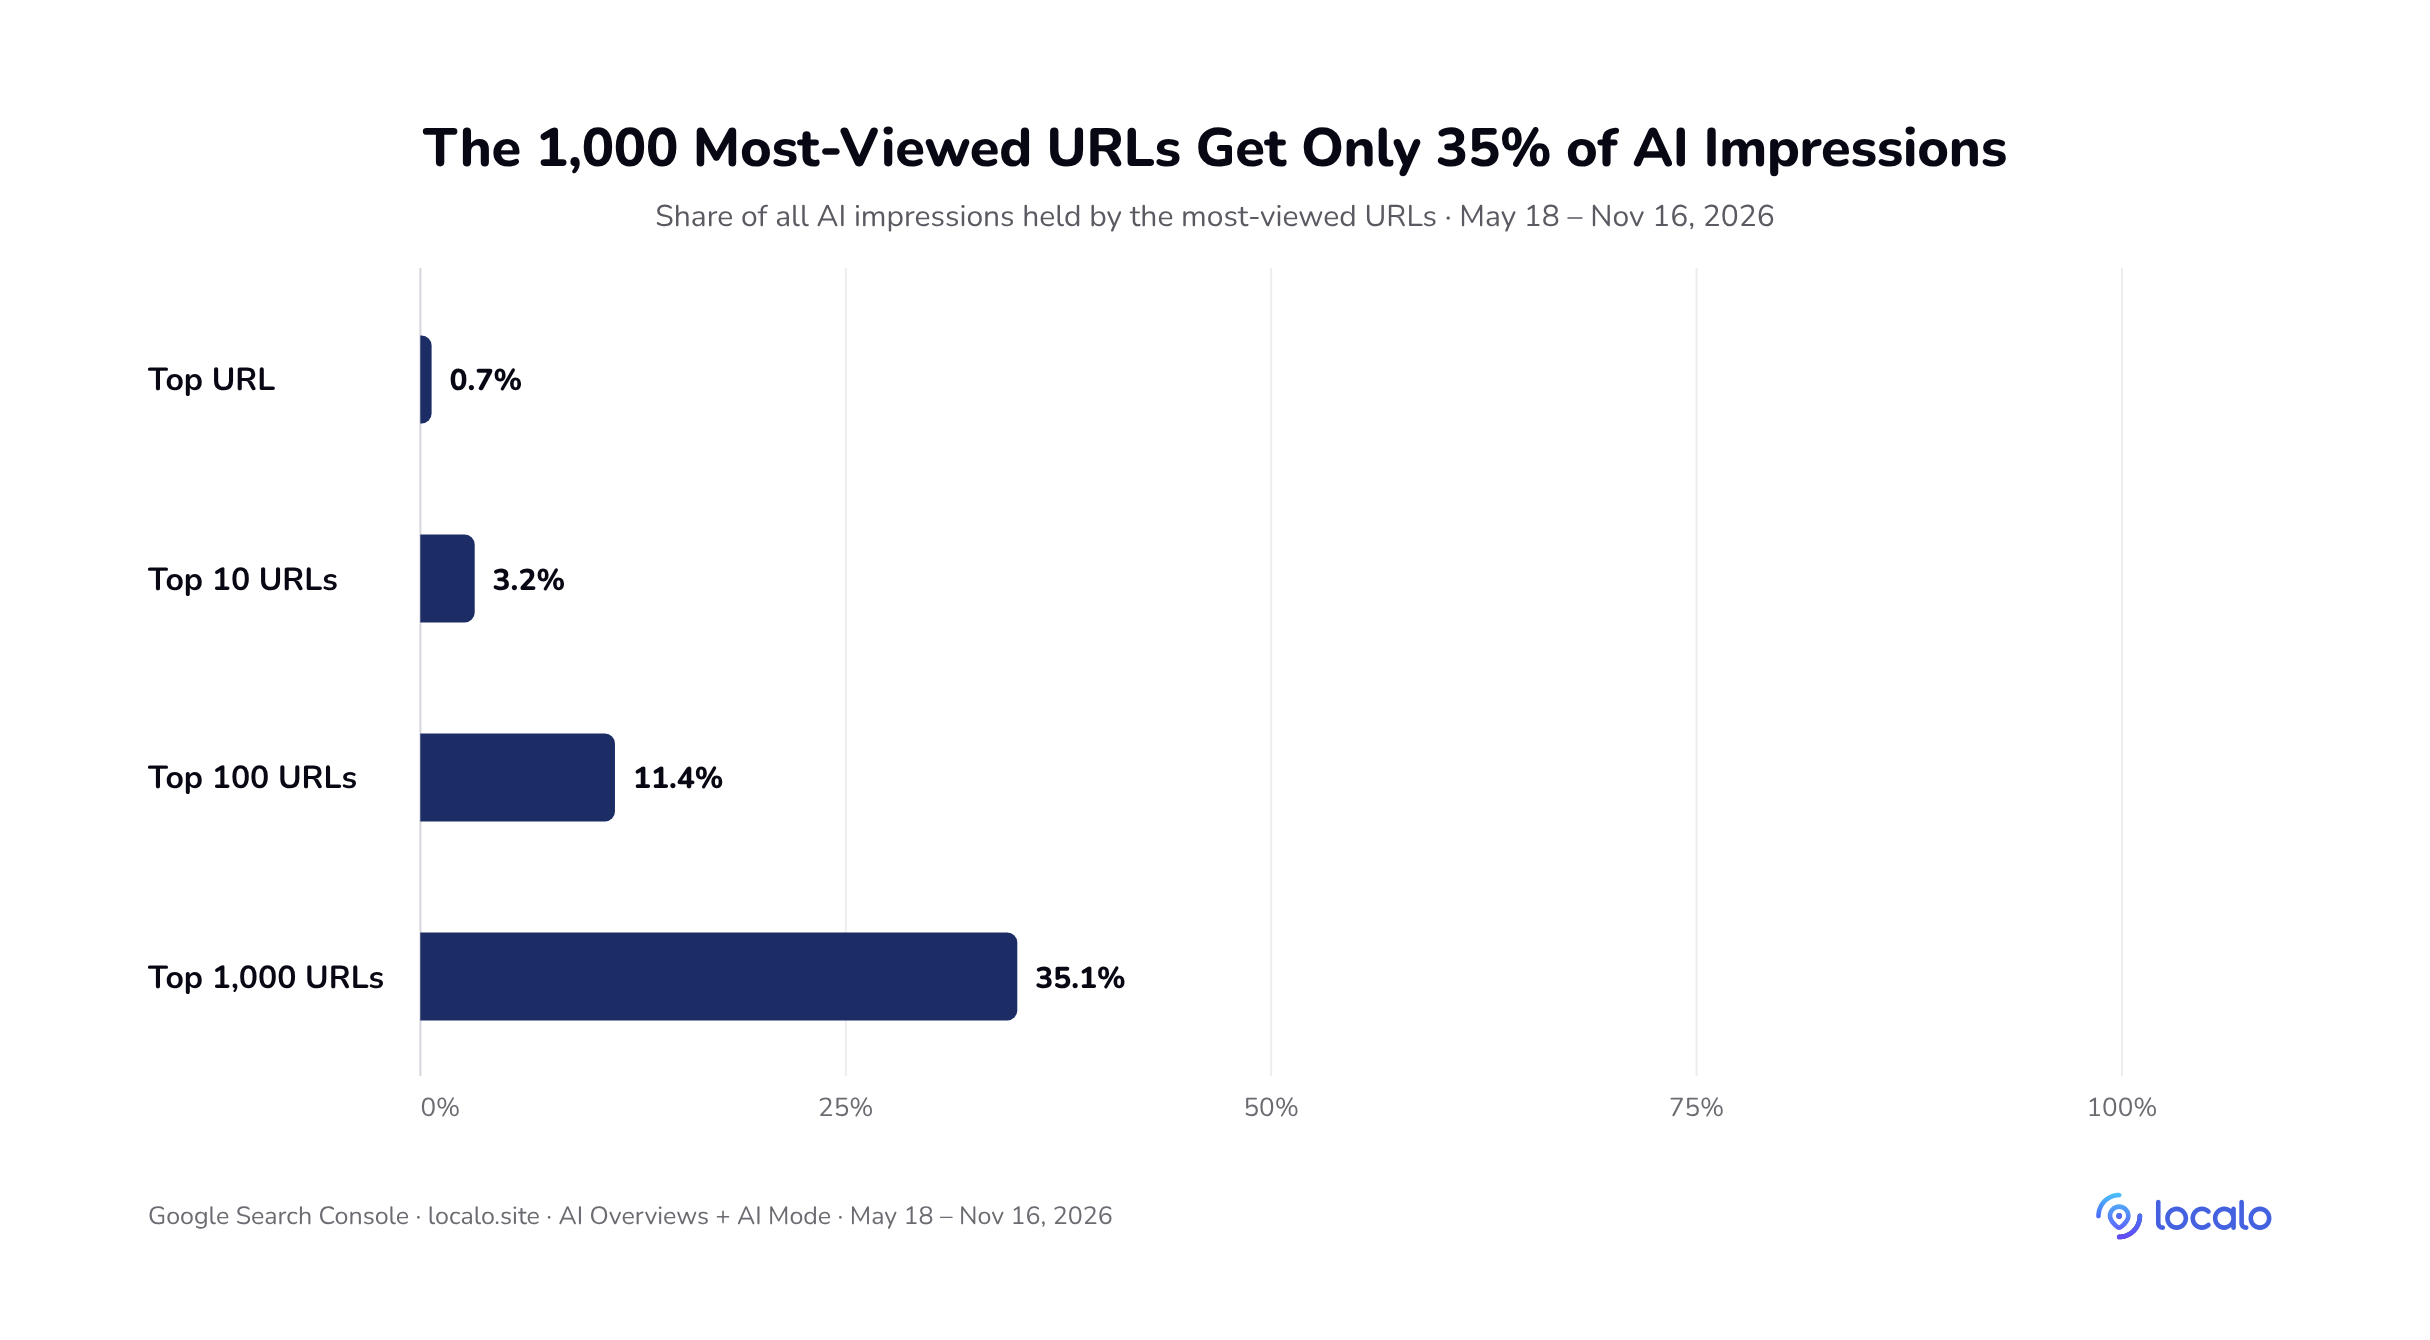
Part of this share comes from how the websites are built. Localo’s Website Builder creates one-page websites with a few extra pages, such as reviews and contact, so most of each website’s content sits on the home page. The 1,000 most-viewed URLs also cover only 35% of AI impressions, and subpages, with fewer impressions each, are more likely to fall below that cutoff. Across all URLs, the home page’s share may be lower.
The impressions are spread across thousands of businesses, not concentrated in a few large ones. The most-viewed URL had 0.7% of all AI impressions. The 1,000 most-viewed URLs had 35.1% together, and they belong to 932 different business websites. Counted by website, with all of a website’s URLs together, the picture is the same: the most-viewed website had 0.7% and the 10 most-viewed websites 3.4%. These shares divide page-level counts by the property total, which counts several localo.site links in one answer as one impression, so if anything they are too high.
🔎 Key takeaway:
AI answers cite the home pages of small local businesses, and no single website dominates.
💡 Tip:
Put the essentials on the client’s home page: services, area, opening hours and contact details that match the Business Profile.
What Specialists Should Do With These Findings
1. Check the Website Field in Every Client’s Business Profile
That field holds the link AI answers show with the profile. In the last week of the data, such links brought 22% of the AI impressions we could classify by URL in the localo.site network. An empty field or a link to an outdated site leaves AI answers without a good page to show.
2. Give Businesses Without a Website a Site to Put There
A business without a website has nothing to put in the field, and AI answers can’t cite its own page. Localo’s Website Builder creates a website from the Business Profile data, and you decide whether to set it as the profile’s website. If a client already has a good website, keep it in the profile: AI answers show the website set there, whichever it is.
3. Add UTM Parameters to the Profile’s Website Link
Only then can you separate impressions of the profile link from other URLs in Search Console. Use a tag that appears only in this link. Our UTM tracking guide shows how, and the method for AI impressions uses the same tagged link. One structure that works is utm_source=google&
4. Keep the Website and the Business Profile Consistent
AI answers combine information from several sources. If opening hours on the website differ from those in the profile, a customer can get a wrong answer. Local brand consistency covers what to align.
5. Keep Posting and Collecting Reviews, Without Overpromising
Regular posts and new reviews went with slightly faster growth. Treat them as steady work for customers, and ask for reviews at a natural pace, because sudden bursts of reviews often get deleted.
6. Report AI Impressions per 100 Search Impressions
In the localo.site network, the ratio went from 1.2 in the first week (May 18–24) to 6.1 in the last week (November 10–16). It tells you whether AI answers show a client more often, even when search traffic doesn’t move. If you also report the impressions of the tagged profile link, name them precisely, for example “Generative AI impressions associated with the website link from the Business Profile”.
How to Check This for a Client in Search Console
- Open Search Console and select the client’s property.
- Under Performance, open the Generative AI performance report (Search). Google describes it in Search Console Help.
- Set the date range, for example the last 3 months, and compare it with the previous 3 months.
- Add a page filter: URL contains the tag used only in the profile’s website link, for example “utm_content=website_button”. You’ll see impressions of the Business Profile link. Switch the filter to “doesn’t contain” to see all other URLs.
- Open the Search results report for the same period and calculate AI impressions per 100 search impressions.
The filter works only if the link in the profile’s website field has UTM parameters, and only from the day you added them. Filtered data can be incomplete: in our case, the two filters together showed about 86% of all impressions. Search Console assigns most data to the canonical URL, so part of the profile link’s impressions can appear under the plain home page URL. Treat the profile figure as a minimum.
Methodology
Localo’s analysis is based on Google Search Console data for localo.site, a domain property that holds the websites built with Localo’s Website Builder (more than 34,000 have been created). We used the Generative AI performance report (Search), which covers AI Overviews and AI Mode, and the Search results report, search type Web, for May 18–November 16, 2026 (183 days), exported on November 18, 2026. The Generative AI report is part of the Web data in the Search results report, so the Search results figures include AI impressions. For the comparison of linked and other websites, we matched the websites with their Google Business Profiles in Localo.
Metric definitions used throughout this analysis:
- AI impressions: the number of times links to a site appeared in AI Overviews or AI Mode. On the property-level chart, several links to the same site in one answer count as one impression. In the pages table, each URL counts separately, so sums by URL don’t equal the property total.
- AI impressions per 100 search impressions: AI impressions divided by impressions in the Search results report for the same period, times 100. That report also counts impressions in AI features.
- Business Profile links and other URLs: URLs whose UTM tags mark the profile’s website link (google_profile or business_profile in the parameters) count as Business Profile links. All remaining URLs are other URLs. Most of them are likely citations of the page, but the report doesn’t say how a page appeared. For the weekly split, we filtered pages by “utm”; among the 1,000 most-viewed URLs, every tagged URL was a profile link. The filtered page-level exports cover about 86% of the property’s impressions in the compared weeks. Because Search Console assigns most data to the canonical URL, the profile share is a minimum.
- URL-level analyses: page types, URL types, the three-month comparison and both samples use exports limited to the 1,000 most-viewed URLs per period. They cover 35% of all AI impressions for the full period and 38–42% in the three-month comparison. In the three-month comparison, the listed URLs grew 1.8x, while the whole network grew 1.6x. Shares of all AI impressions divide page-level counts by the property total.
- Linked and other websites (sample 1): the URL list of the three-month comparison includes 1,338 localo.site websites. We kept the 1,066 that were live for at least six months and matched with their Business Profiles in Localo, and compared them between May 18–August 16 and August 17–November 16, 2026. We measure impressions of the localo.site website only, not the businesses’ other websites. The profile’s website link is today’s setting; its history is known only for part of the profiles.
- Fastest-growing websites and websites without growth: the 25% of websites with the largest growth in AI impressions, and websites with no growth or a decline.
- Adjusted differences: estimates for the 1,066 websites in sample 1 that account for country, the starting number of AI impressions and, for profile activity, the profile link.
- Split of the increase (sample 2): websites in the URL list of the three-month comparison with at least 50 AI impressions in the first period: 170 whose Business Profile link appears in the list and 960 without one. This sample overlaps with sample 1 but is selected differently, so the counts don’t add up to 1,066. The medians for other URLs compare the 78 of the 170 websites with at least 50 such impressions in the first period (median ×1.53, 95% bootstrap confidence interval ×1.20–1.81) with the 960 others (median ×1.24, interval ×1.14–1.36).
- Business Profile activity: posts, reviews, replies, offers and photos from Localo data, for websites linked from the profile.
- Google reporting errors: Google reports logging errors that lowered impressions in the Generative AI performance report on August 13–17 and November 9–11, 2026 (Search Console Help). In localo.site’s daily data, these days don’t stand out from the weekly pattern. Leaving out November 10 and 11 would raise the last week’s average from 31,592 to 32,685 a day, so the end-of-period figures are, if anything, conservative. The August ratio stays at 1.72 without the affected days, and each three-month period includes four of them.
All results describe associations in the data, not proof of cause. The data covers the whole localo.site network, and a single website can behave differently.
Frequently Asked Questions About Local Businesses in Google’s AI Answers
Does the Search Console generative AI report show clicks?
No. It shows only impressions. It also has no queries and no split between AI Overviews and AI Mode.
How do I know whether an AI impression came from the Business Profile?
Check the URL. The link in the profile’s website field is the one with your UTM parameters. That tagged URL doesn’t appear on the website itself, so in practice Google knows it only from the profile. Treat the count as a minimum: Search Console can assign part of these impressions to the plain URL.
Does a link from the Business Profile increase AI impressions?
In our data, localo.site websites linked from the profile grew their AI impressions by a median 76%, and localo.site websites whose profile linked to a different site lost 9%. We don’t see the other sites, so this doesn’t measure the businesses’ total visibility. Most of the difference came from Business Profile links. It’s an association, not proof of cause.
Is localo.site better for AI answers than a business’s own website?
The data doesn’t show that. It shows that AI answers link to the website the business set in its profile. Many businesses with localo.site in the profile have no other website.
Do Business Profile posts and new reviews increase AI impressions?
We can’t say. Regular posts and a new review every week went with about 10–20% more growth after adjustment, but we didn’t establish whether that’s cause and effect. Reviews can also be an effect: a business with more customers gets more reviews.
Why did AI impressions jump at the end of October 2026?
We don’t know for sure. The network’s combined impressions jumped within two days, which more likely points to a change on Google’s side. On October 15, Google announced more links in AI responses, but without rollout dates.
Do more AI impressions mean more customers?
The data doesn’t show that. The report has no clicks, and appearing in an AI answer doesn’t mean a visit to the website. Check clicks, calls and direction requests in the profile’s performance data as well.
Sources
- Google Search Central, (2026) Introducing Search Generative AI performance reports in Search Console
- Google Search Console Help, Generative AI performance report (Search)
- Loew, M., (2026) New opportunities, control and insights for website owners, Google
- Budaraju, H., (2026) More ways to connect with the web from Search, Google
- Google France, (2026) Lancement des Aperçus IA et du Mode IA dans la Recherche Google en France
- Google Search Console Help, Data anomalies in Search Console
- Żarnowski, S., (2026) How to Track Google Business Profile Impressions in AI Results, LinkedIn